
In 2014 eight family medicine organizations crafted Family Medicine for America’s Health (FMAHealth), a specialty-wide strategic plan. FMAHealth’s board of directors charged its Payment Team with an objective considered to be the plan’s lynchpin aim: to help primary care practices, employers, and payers move as quickly as possible from a fee-for-service (FFS) payment framework to a comprehensive primary care payment (CPCP) framework.
SPECIAL ARTICLES
Development, Value, and Implications of a Comprehensive Primary Care Payment Calculator for Family Medicine
Report From Family Medicine for America’s Health Payment Tactic Team
Aaron George, DO | Neha Sachdev, MD | John Hoff, BA | Stanley Borg, DO | Thomas Weida, MD | Malachi O'Connor, PhD | Kisha N. Davis, MD, MPH
Fam Med. 2019;51(2):185-192.
DOI: 10.22454/FamMed.2019.286478
Return to Issue
Background and Objectives: Fee for service (FFS), the dominant payment model for primary care in the United States, compensates physicians based on volume. There are many initiatives exploring alternative payment models that prioritize value over volume. The Family Medicine for America’s Health (FMAHealth) Payment Team has developed a comprehensive primary care payment (CPCP) model to support the move from activity- and volume-based payment to performance-based payment for value.
Methods: In 2016-2017, the FMAHealth Payment Team performed a comprehensive study of the current state of primary care payment models in the United States. This study explored the features, motivations, successes, and failures of a wide variety of payment arrangements.
Results: The results of this work have informed a definition of comprehensive primary care payment (CPCP) as well as a CPCP calculator. This quantitative methodology calculates a base rate and includes modifiers that recognize the importance of infrastructure and resources that have been found to be successful in innovative models. The modifiers also incorporate adjustments for chronic disease burden, social determinants of health, quality, and utilization.
Conclusions: The calculator and CPCP methodology offer a potential roadmap for transitioning from volume to value and details how to calculate such an adjustable comprehensive payment. This has impact and interest for all levels of the health care system and is intended for use by practices of all types as well as health systems, employers, and payers.
The dominant mode of payment for primary care in the United States is FFS, where a provider is compensated for the number of tasks performed. This encourages a focus on illness and quantity rather than health and quality. Continued increases in the cost of care, in aggregate and to the patient, as well as mounting evidence that investments in quality reduce long-term costs, support the need for alternative and value-based payment models. Patient-centered medical home (PCMH) programs and accountable care organizations (ACOs) have helped create a culture of measurement, accountability and innovation in primary care. FFS-based payment, however, is still used in these care delivery models and has limited their potential. While the conversation continues on the importance of innovation within primary care payment, current payment systems lack the ability to truly recognize and incent quality, performance, outcomes, and value.
In 2015-2016 the FMAHealth Payment Team carried out a comprehensive review of the current state of primary care payment models in the United States. The review explored the features, motivations, successes, and failures of a wide variety of payment arrangements.1 The results of this work have informed a definition of comprehensive primary care payment (CPCP) as well as development of a payment calculator, each a part of a framework for next-generation primary care payment.2
The first annual Starfield Summit—a national conference focused on advancing primary care—defined CPCP as:
payment-based in risk-adjusted per member per month (PMPM) fees designed to cover all practice expenses including salaries, infrastructure, and health information technology; this differs from traditional capitation where payments were based on average FFS expenditures and is intended to increase overall financial support for primary care practices.3
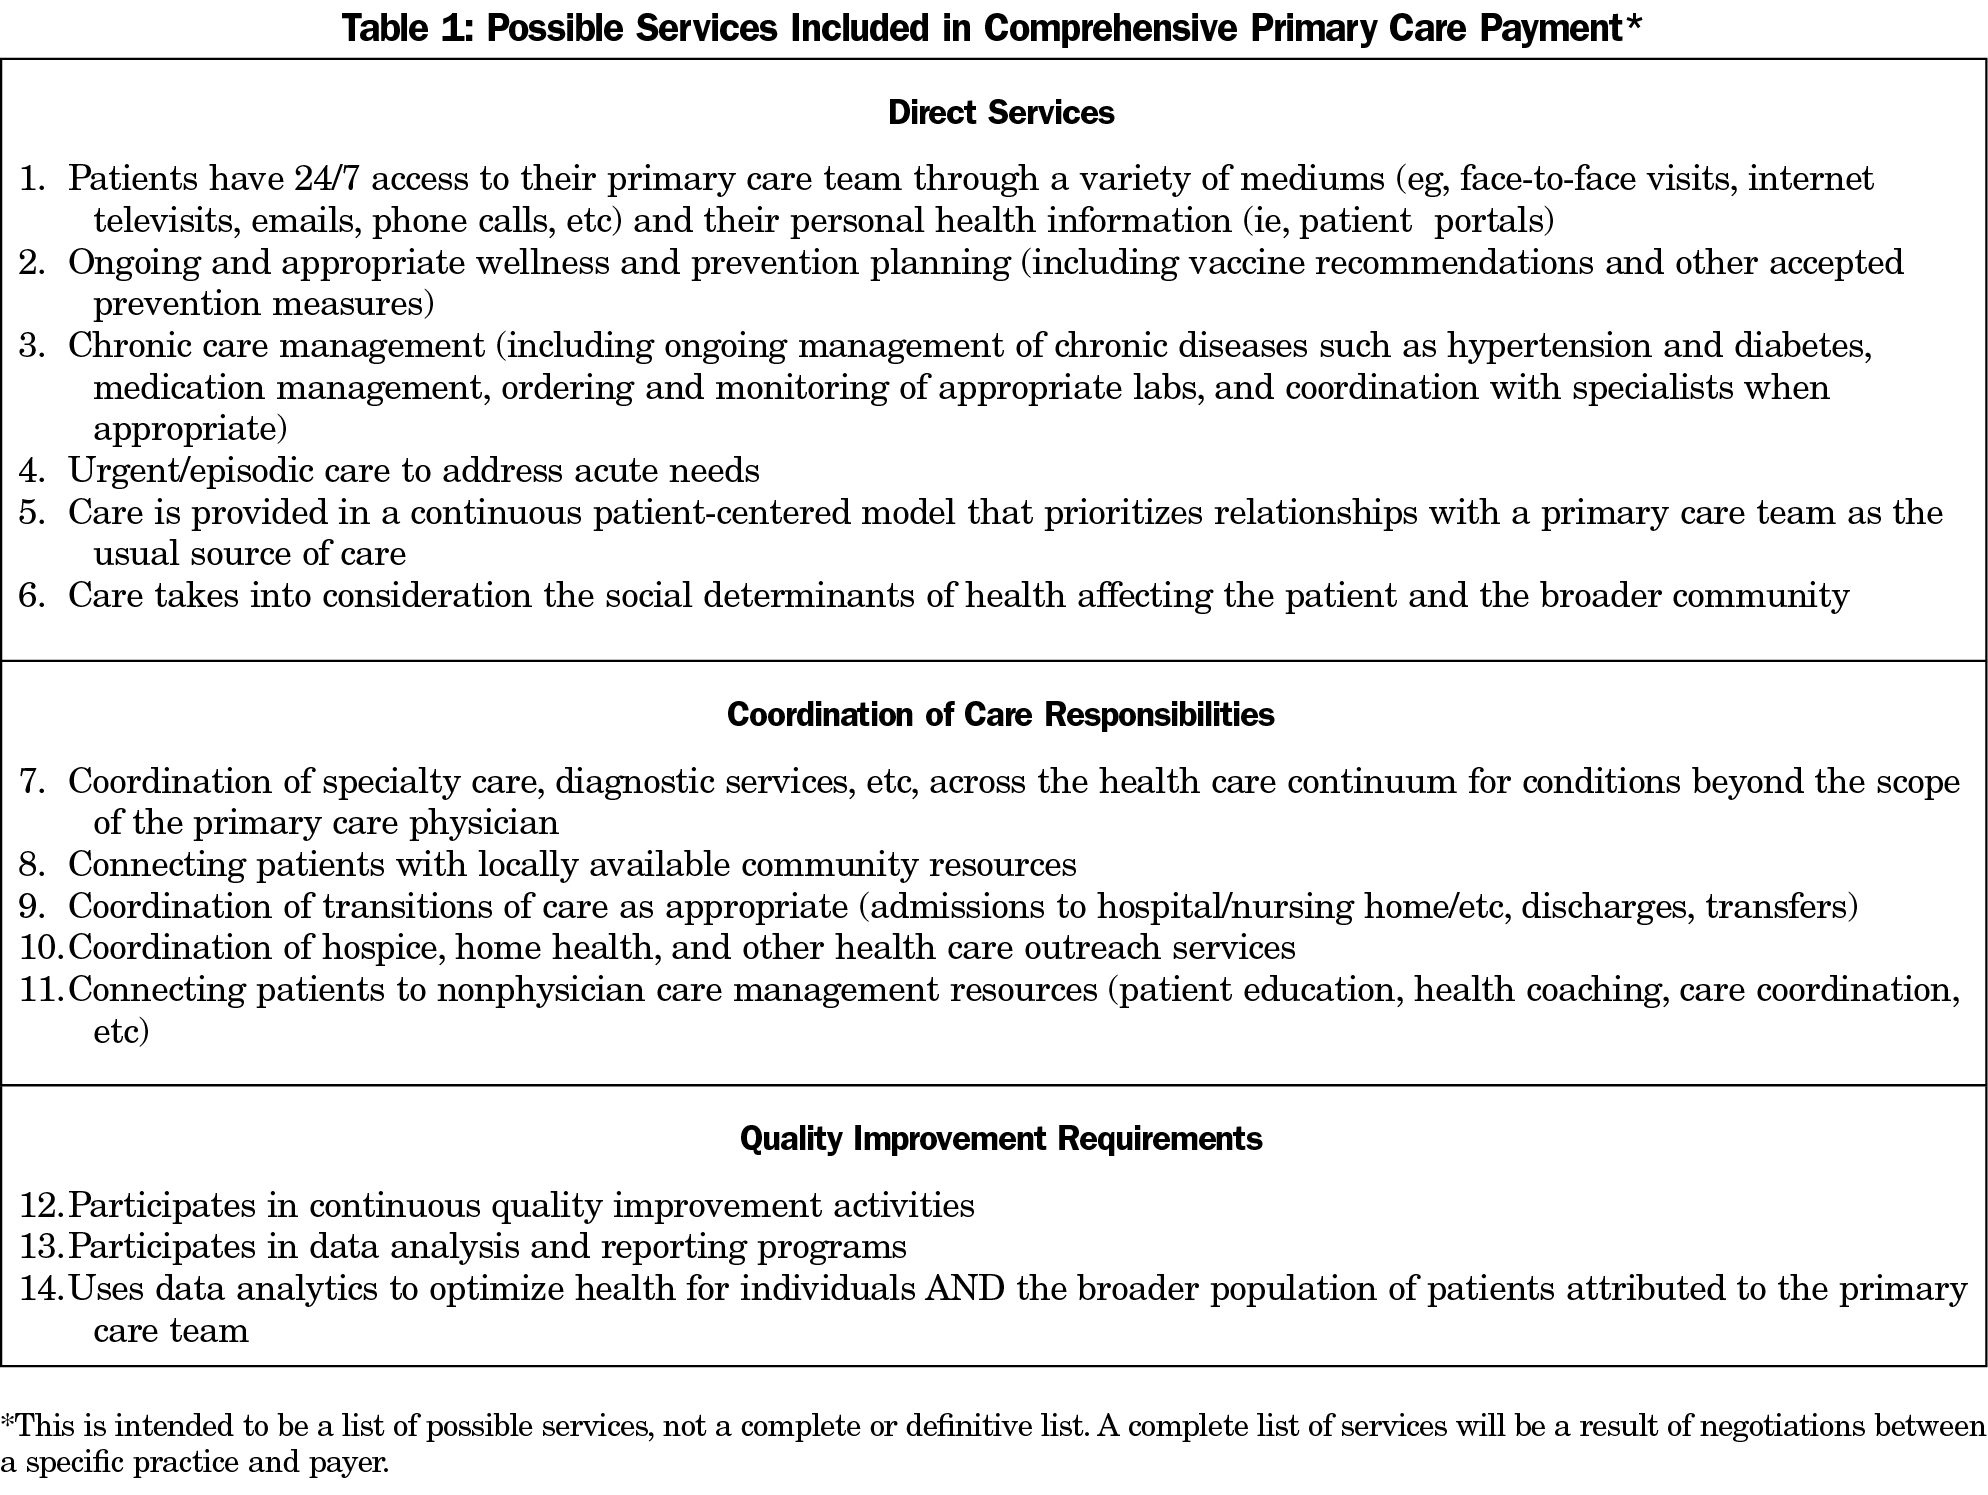
CPCP represents a new investment in primary care, with substantial increases in payment over current levels. This requires outlining a set of services that are to be included in a robust primary care model, inclusive of direct services, responsibilities for coordination of care, and requirements for quality improvement (Table 1).
The team’s objective has been constant throughout, to move as quickly as possible from FFS to CPCP. To do this requires moving beyond the conversation about the importance of primary care payment reform toward expansion of a practical model for its implementation. To achieve that goal and refine the calculator as needed, the Payment Team is holding discussions with selected payers, employers, and practices around the United States.
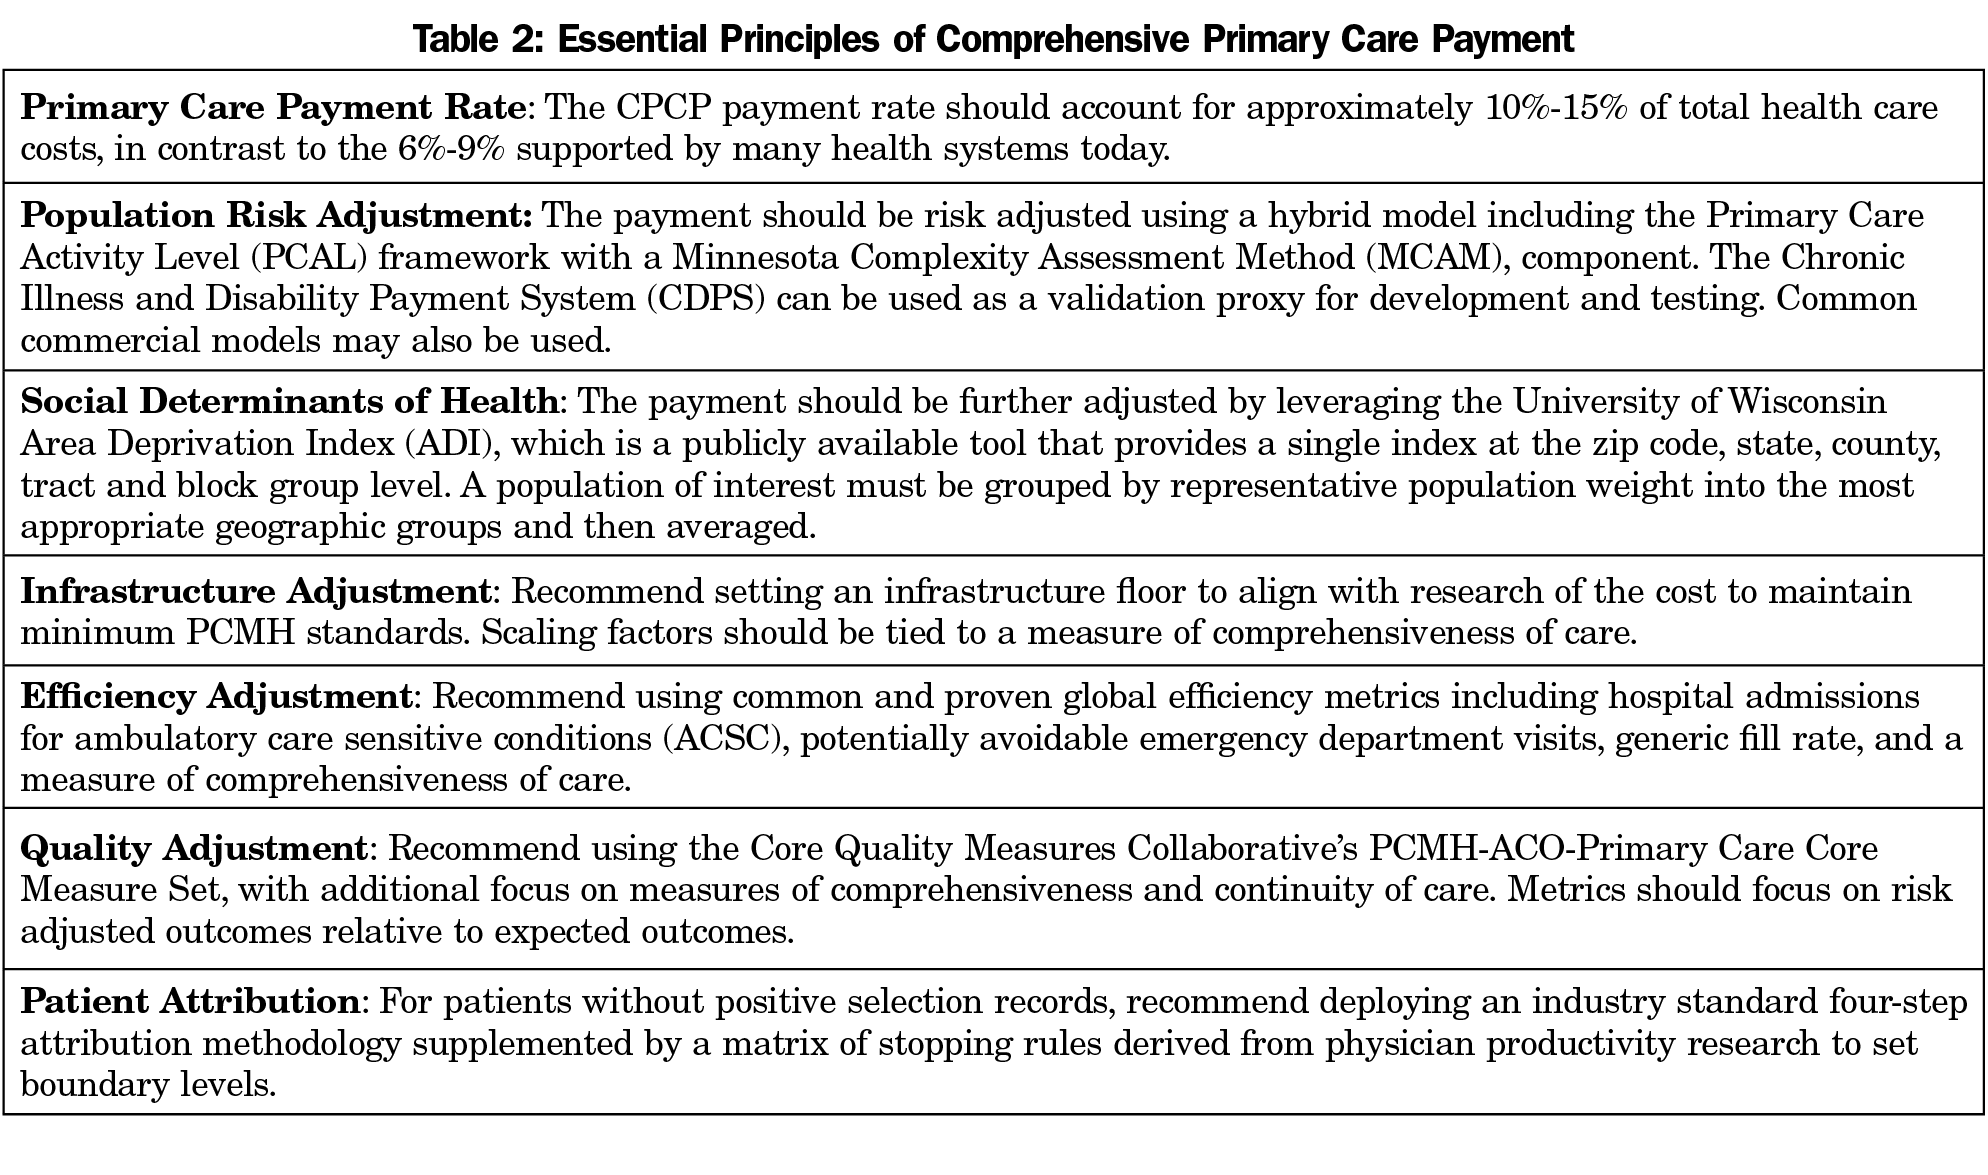
In contrast to FFS reimbursement, CPCP incorporates adjustments for chronic disease burden, social determinants of health, quality, and utilization. We outline the essential principles for structuring comprehensive primary care in a way that includes these adjustments in Table 2 and provide model case examples below. The outline is based on detailed background and methodological reports that can be accessed at www.fmahealth.org.1,4
This methodology applies these recommendations by calculating a base rate that is driven by current FFS payment history for a specific patient population and then applying four modifiers to account for currently unreimbursed factors. These modifiers adjust the base rate to account for patient risk and social determinants of health for the population in question. They also provide adjustments for quality, efficiency, and infrastructure for the primary care practice/patient population in question.
The four components of the CPCP model provide the necessary details to calculate a prospective reimbursement schedule using the base rate and modifiers. This “calculator” can be used as a resource in a variety of settings to help understand what payment could look like using a CPCP framework. The CPCP calculator and an accompanying user’s guide can be accessed at https://fmahealth.org/payment-tactic-team/#1505048214728-3cff81aa-f295.
A. Base Rate
To adequately fund a CPCP model, we recommend setting the total primary care payment rate to account for approximately 10%-15% of total cost of care (TCOC). Comprehensive services included in a CPCP payment are: direct services, coordination of care responsibilities, and quality improvement (Table 1).5
To derive an estimate of the payment level necessary for a comprehensive payment, calculate the primary care activity level (PCAL) for the population of interest and set this as an upper bound reference (refer to Appendix 1 [https://journals.stfm.org/media/2041/george-appendix1.pdf] for details on calculating the PCAL). The PCAL model incorporates FFS primary care dollars as well as resources spent on other types of care that could be impacted by primary care such as spending for prescription medications, ED visits, hospital admissions, and specialty care. Addressing simple problems in primary care that might otherwise be referred out, managing chronic problems to avert crisis care management, coordinating care for patients during and after hospitalizations and prescribing generic medications can reduce total health care costs.
B. Modifier 1: Population Adjustment
Population health risk adjustment models play a critical role in avoiding adverse selection, to balance panels and allocate primary care resources. The Minnesota Complexity Assessment Model (MCAM), provides a framework for multilevel assessment that accounts for both evidence-based risk and heuristics for barriers to care.6 The US Social Deprivation Index (SDI) provides a framework with which to model adjustments to compensate for social determinants of health in comprehensive primary care, with specific attention to income and education level. The Social Deprivation Index is positively associated with poor access and poor health outcomes, and it is more strongly associated with health outcomes than a measure of poverty alone. We recommend a hybrid risk model using three components: a standard commercial or open-source risk model, along with MCAM, and SDI. Together they account for 5% of the total CPCP rate.
An adjustment for social determinants of health may be estimated from the University of Wisconsin Area Deprivation Index (ADI), a publicly available tool that provides a single index at the zip code, state, county, tract, and block group level. A 2014 study showed that the top 15% most disadvantaged households experienced a significant increase in health impact, particularly for readmission rates.7 The ADI tables are packaged into the prospective calculator, and instructions for creating an area-level averaged ADI estimate are included.
C. Modifier 2: Quality Adjustment
The CPCP model supports a robust and flexible approach to performance measurement. Improved health outcomes, beyond the provision of health care services alone, should be the goal of the health care delivery system. The CPCP methodology encourages both superior outcomes and incremental improvement toward them, even for those patients who have not achieved a targeted goal.
We recommend conforming to the PCMH-ACO-Primary Care Core Measure Set.8 This set of primary care quality measures was developed through consensus by the Core Quality Measure Collaborative as a minimum standard set of metrics for PCMH and ACO applications.
D. Modifier 3: Efficiency Adjustment
Efficiency metrics are a critical component of any measurement model, and these are particularly important for a comprehensive payment model. Current research points to the value of measuring comprehensiveness of care to assess the impact of physicians on the health of their patients. While more difficult to determine consistently and empirically, comprehensiveness has been shown to be a key indicator of overall primary care effectiveness and efficiency. In a CPCP framework, payments are included to help offset the costs of maintaining hybrid claims and survey-based measures of comprehensiveness.
To create an aggregated scoring, we recommend that a CPCP model include at least eight Ambulatory Care-Sensitive Conditions (ACSC) admission measures, at least one potentially avoidable emergency department measure, and at least one of either generic fill rate or comprehensiveness of care.
E. Modifier 4: Infrastructure Adjustment
The purpose of the infrastructure adjustment, or care management fee mechanism, is to support the transition from the transactional visit-based model to one of team-based care focused on outcomes. Team-based care has two overarching goals: (1) to reduce inefficiencies by delegating clinical work across a team that can work more efficiently than a single physician, and (2) to improve the comprehensiveness of care, eg, to detect and address unmet needs and reduce unneeded resource utilization. This adjustment enables primary care practices to assemble and maintain the resources necessary to provide high-quality and efficient care for their specific patient population. With payment no longer tied to office visits alone, the practice may use nonphysician staff (RNs, LPNs, medical assistants, etc) to support patient care and follow up.
The maximum infrastructure adjustment a practice may receive is set at an absolute $7.50 PMPM, regardless of its percentage of the TCOC. Assessment of the practice can be made relative to the suggested components of primary care services listed in Table 1.
F. Final Rate Calculation
The final rate calculation is a sum of the base rate estimate and the four modifiers. The base rate and modifier schema is intended to serve as a framework for calculating CPCP. It is understood that each population, payer, or provider will likely have idiosyncrasies that must be accommodated for contracting and/or other pragmatic purposes. This payment framework provides a starting point for further refining and negotiation of a mutually beneficial CPCP model. The simulated case studies that follow are designed to illustrate two realistic applications of this methodology.
In order to guide practices, employers, and payers, a calculator user guide has been devised. The CPCP Calculator and an accompanying user’s guide can be accessed at: https://fmahealth.org/payment-tactic-team/#1505048214728-3cff81aa-f295. Further, below we provide two practical examples to illustrate how a practice or a self-insured employer could approach understanding the difference between payment in an FFS framework and payment using a CPCP framework.
ABC Primary Care Practice
ABC Practice is a relatively new primary care clinic that has embraced patient-centered medical standards from its inception. It has an electronic health record and has invested heavily in population health management. It has 3.5 FTE primary care providers, 5 medical assistants, 1 FTE registered nurse, and a 0.5 FTE population health coordinator. They have 5,200 patients and expect 3% growth over the next year. It is located in a suburban area in the Mid-Atlantic region with an area deprivation index of 74.52%. It has a majority middle-income population. Their payer mix is majority commercial insurance at 87% with 4% Medicaid and 9% Medicare. They participate in an Accountable Care Organization and take advantage of PCMH incentives through one of their commercial insurance carriers.
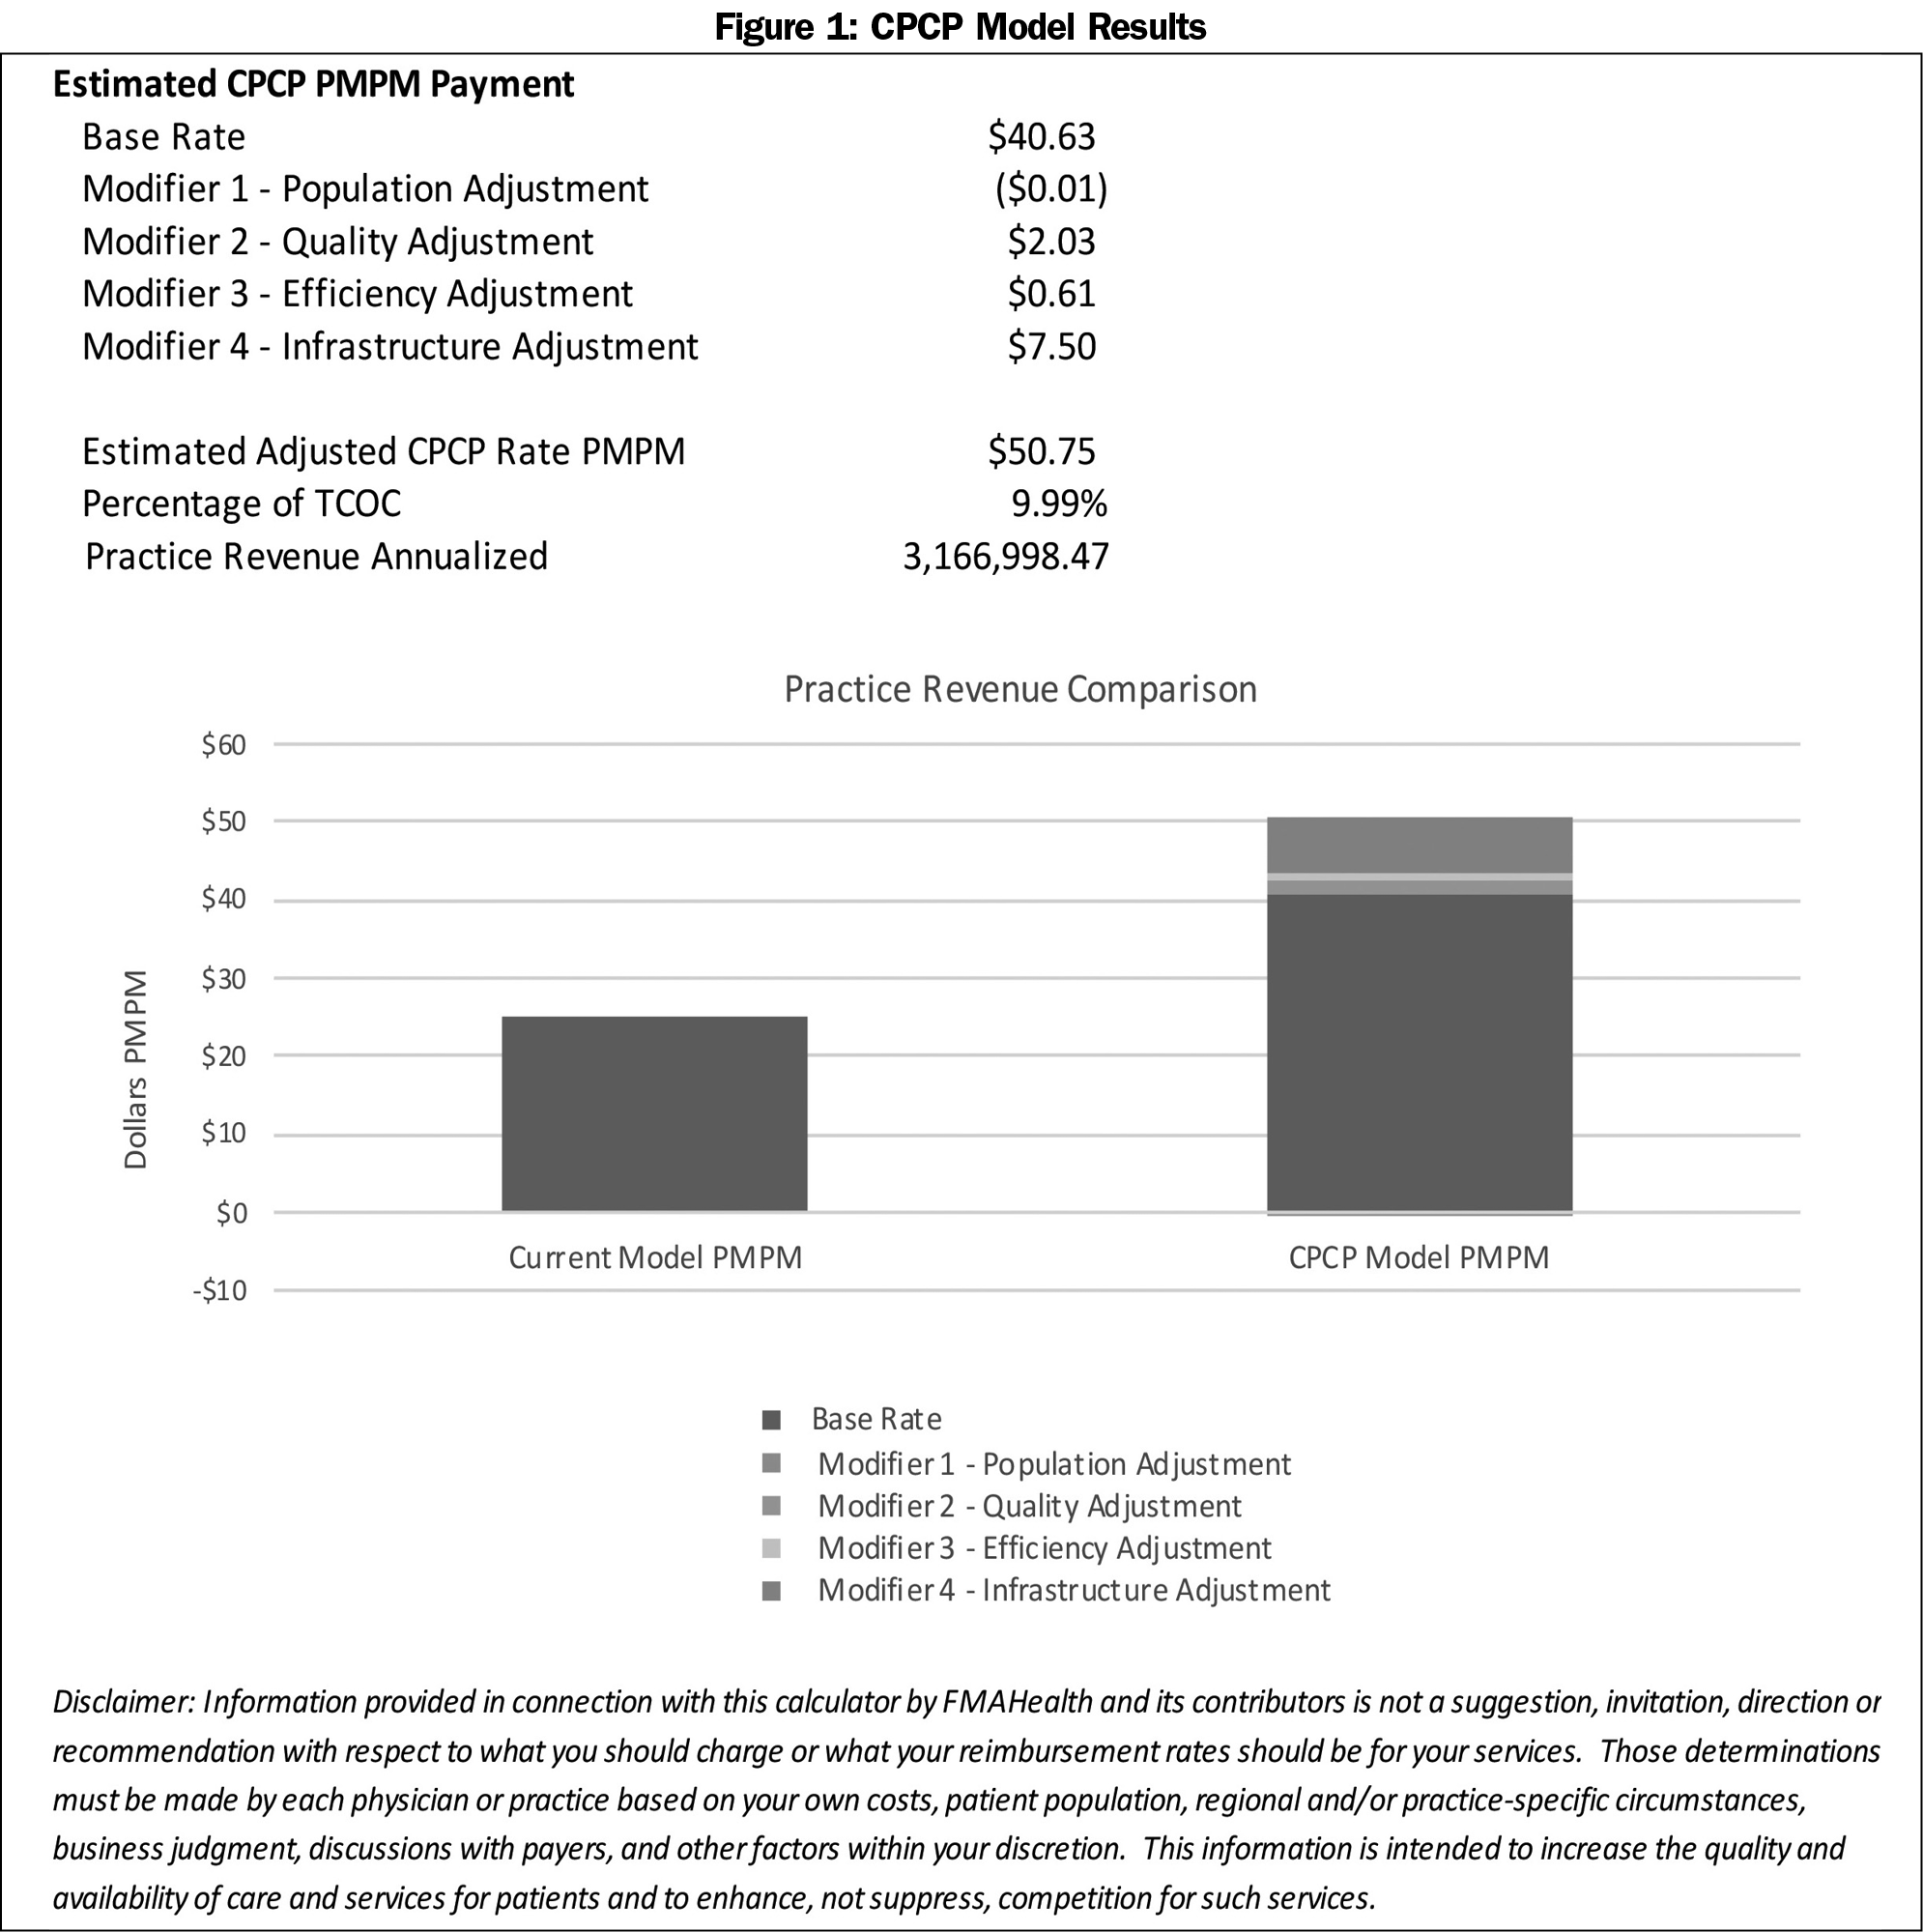
Using the CPCP Calculator, ABC Practice generated the data listed in Figure 1. Under an FFS model they would generate $25.21 PMPM. However, when a Comprehensive Payment Model is applied they receive $50.75 PMPM. This would more than account for many of the infrastructure investments made in technology and personnel. The primary care percentage of total cost of care under the FFS model is 4.4%. Meanwhile, the comprehensive payment model demonstrates the primary care estimated percentage of total cost of care at 10%, which is more in line with recommended targets. A comprehensive payment model would more appropriately compensate this practice for managing the health of the population they are serving beyond episodic visits.
XYZ Company: Self-Insured Employer
XYZ Cable is a midsized, Arizona-based telecommunications company with 2,100 employees and a total of 3,990 covered members. They are self-insured and contract with a third-party administrator for processing and administration, as well as a reinsurer. They offer their employees a generous health benefit with low deductibles but high premiums and copays. The group’s members are geographically dispersed across southern Arizona, but due to the rurality, roughly 60% are still attributable to Tucson Primary Care Associates (TPCA).
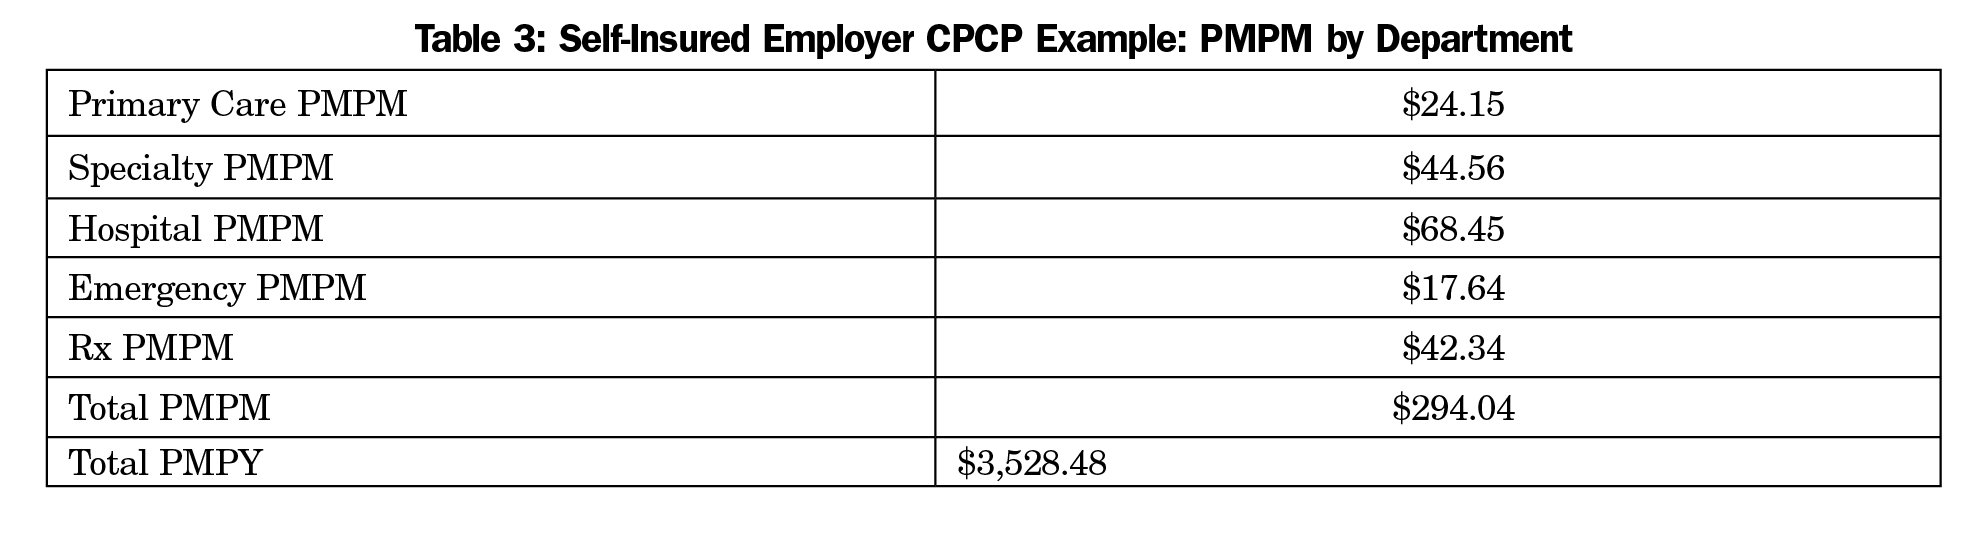
Table 3 details a TCOC report showing PMPM payments for a variety of services based on 2016 claims data.
Using the PCAL standard weights, the standard base rate is $23.52. The population ADI is 1.17 and considerably higher than average. Therefore, it reaches the threshold necessary for an adjustment of $5 PMPM. In the prior year, TCPA met the threshold for only 4 of the 10 quality measures resulting in a 1% adjustment for Modifier 2, the quality adjustment. Upon review of prior year claims-based performance, TPCA achieved contributions from admission measures, potentially avoidable emergency department measures, and a contribution from physician and behavior access measures resulting in a 2.5% adjustment for Modifier 3, the efficiency adjustment. Lastly, TPCA is a traditional primary care clinic that has been slow to adopt patient-centered medical home standards such as team-based care and electronic medical records. TPCA receives the base $5 PMPM to invest in infrastructure needed but does not receive other infrastructure payment adjustments at this time. TPCA will be eligible for rescoring based on infrastructure gains made in the coming experience year. See Appendix 2 (https://journals.stfm.org/media/2042/george-appendix2.pdf) for detailed calculations.
XYZ’s previous investment in primary care averaged $24.15 PMPM. However, utilizing CPCP modeling, primary care investment increased to 12.1%, translating to $35.47 PMPM.
A CPCP model creates a more efficient use of practice resources that results in direct cost savings. It sets up practices to take advantage of payment incentives for adopting the functions of a PCMH, and at the same time better prepares them for enhanced payment under the Merit-based Incentive Payment System (MIPS) or Alternative Payment Models (APMs). In this model, the effort put forth outside the patient encounter to coordinate care and decrease resource utilization would be valued over episodic in-person encounters only.
Several recent pilots and experiments have started to demonstrate success in advancing payment, including Medicare’s Comprehensive Primary Care Plus (CPC+) model. In CPC+, a retrospective quarterly care management fee and performance-based incentives are layered on top of the traditional Medicare physician fee schedule. While improvements have been noted in terms of access, delivery of care to high-risk populations and decreased emergency department visits, the program is currently slated to end in 2019.9 CPCP provides one possible transition path for clinics and systems, such as those involved in CPC+, that have begun a transition away from FFS.
The major lesson that the Payment Team learned is that no one size fits all when it comes to primary care practice or payment. Models need be flexible and attentive to the community and population being served, and payment may vary greatly as a consequence. This comprehensive payment model may not work for every practice. Practices, for example, that are high volume with little accountability for quality or value can thrive in a FFS framework. As it has been the dominant payment model for so long, many practices would have to make significant changes to their business models to be successful in a CPCP framework. CPCP requires investments in population health management and technology to track quality measures, and some practices do not currently have the culture, teamwork, or personnel to advance these—although increased prospective payment through CPCP can make many of these changes possible. At the same time, we believe these changes will be worthwhile to many physicians, practice teams, and patients alike. Perhaps the greatest lesson learned, and a common theme among all primary care models reviewed, is that leadership and a supportive organizational culture are necessary for CPCP to work well.
Primary care in the United States is transitioning from an illness model to a health model. This transition can better ensure higher quality of care at lower cost for individuals and populations, while improving the lives of physicians and their practice teams. Health care delivery and payment are too intrinsically linked to change independently, and movements to value-based care must be accompanied by value-based payment.
We believe that family medicine as a specialty should embrace the structure of comprehensive care and advance implementation of this payment calculator. The upfront prospective payments associated with CPCP make the transition less daunting for practices, and the rewards in improved health outcomes and patient and professional satisfaction are well worth the investment. With CPCP, reimbursement is uncoupled from visits, leading to decreased administrative burden and greater flexibility to use different modalities for patient encounters (eg, group visits, home visits, telehealth visits).
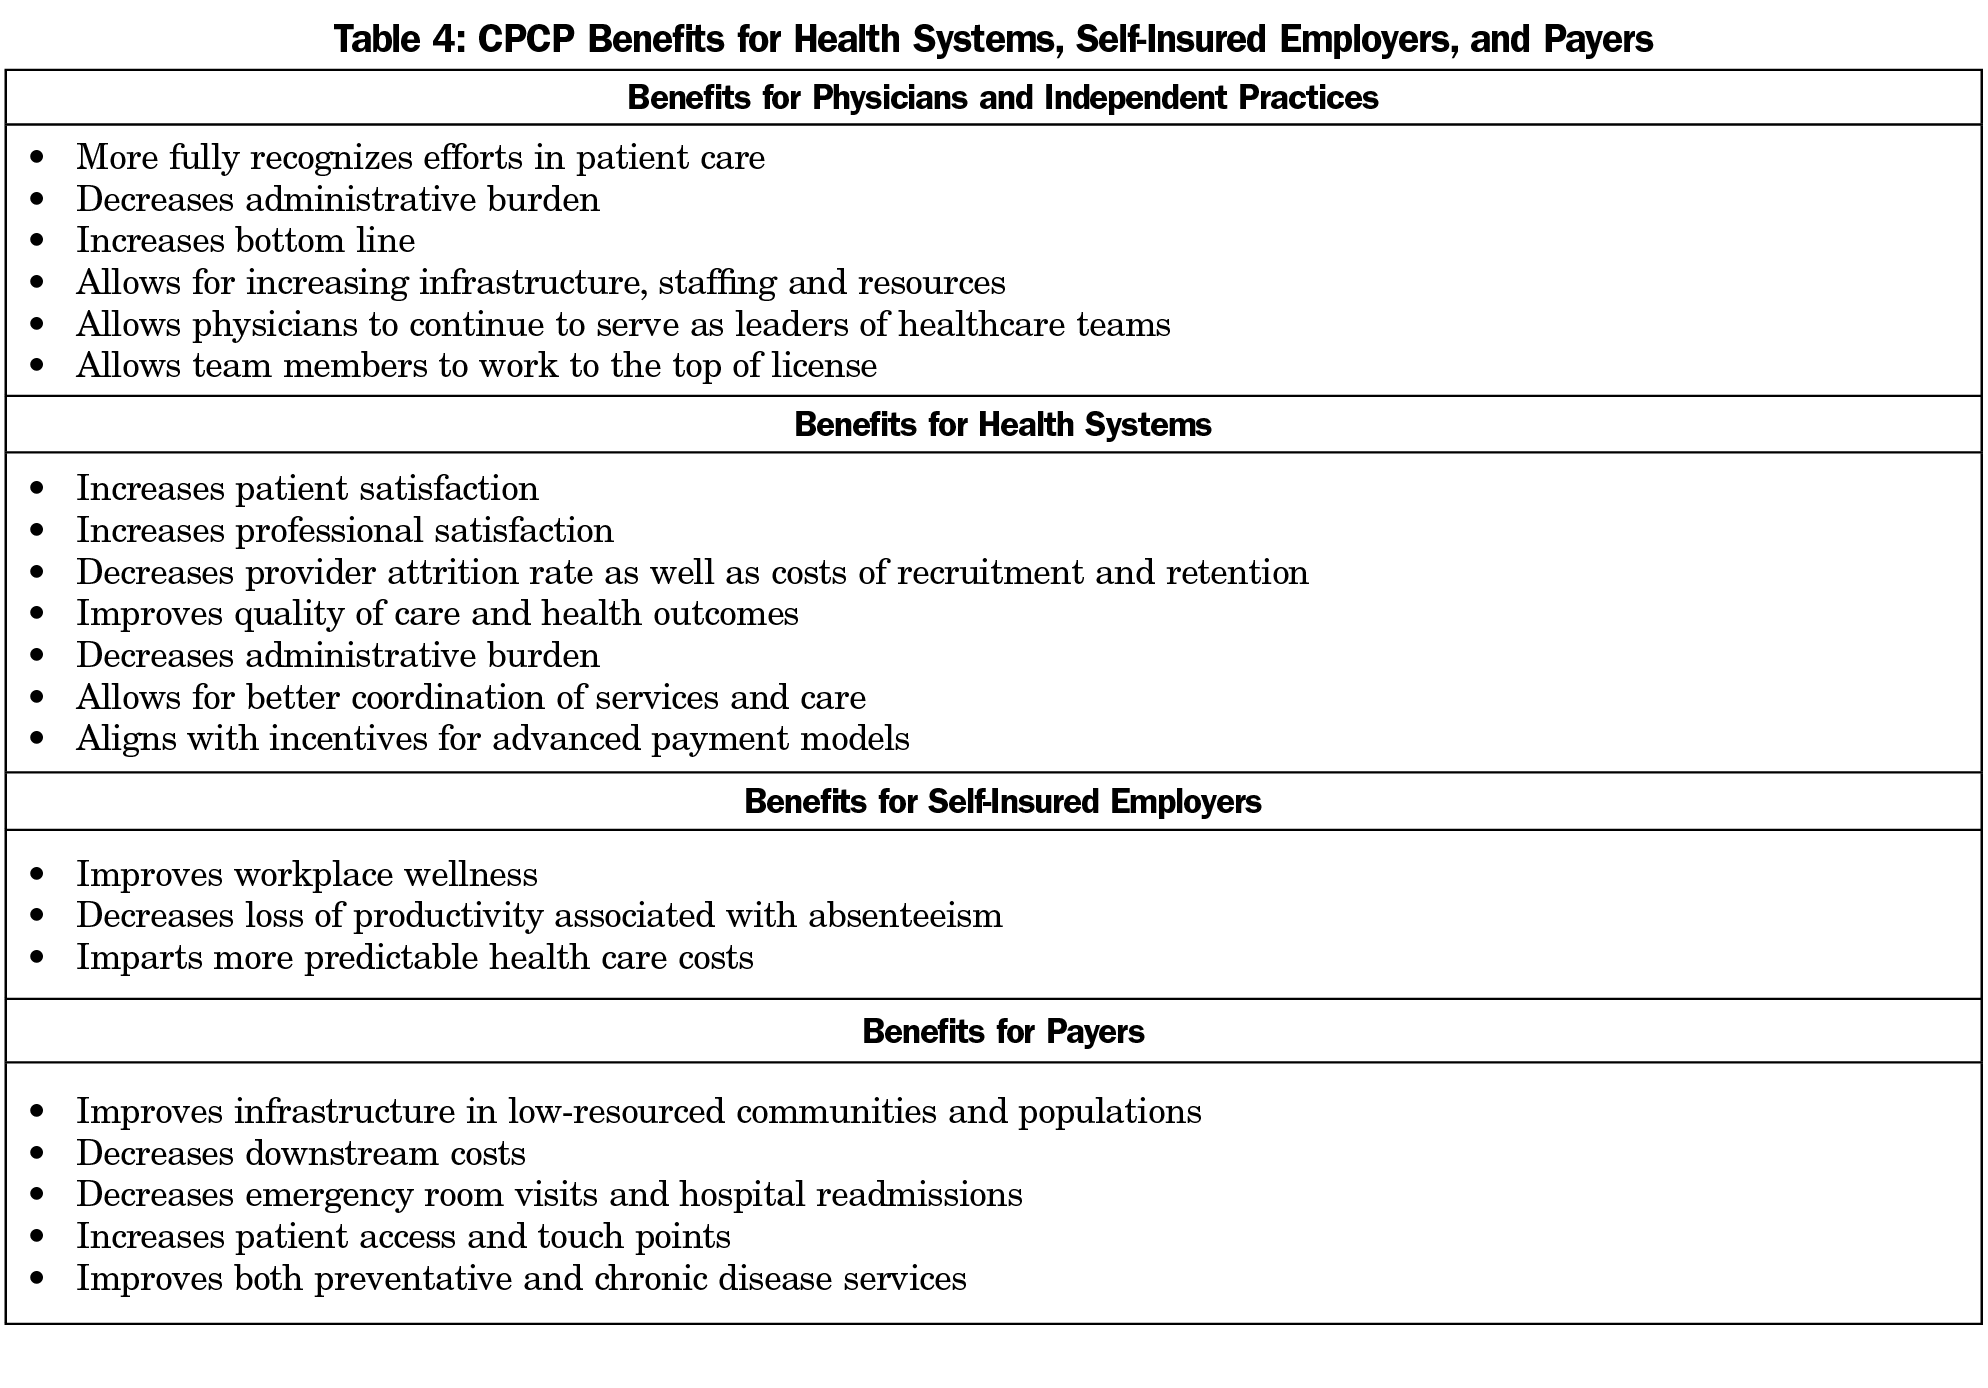
We believe there are benefits for health systems, self-insured employers, and payers to move to Comprehensive Primary Care Payment as well and list some of them in Table 4.
While the model calls for an increased investment in primary care, this investment is both strategic and purposeful. For physicians, this model creates the opportunity to be reimbursed for practice patterns and care objectives that benefit patients as well as the health care system. Physicians and practice groups participating in a CPCP contract should see their revenue and professional satisfaction improve in proportion to their commitment to the principles driving this model. This alternative payment model is designed to create complementary incentives between payers and practitioners and is a flexible framework that can be adjusted by both payers and practitioners for a wide variety of populations, geographies, and existing contracting arrangements.
This paper is written to advance the conversation from discussion to implementation. We encourage health systems administrators, practice managers, employers, insurers and public servants to work with the calculator, test its method and put its components to work. We believe it can serve as an excellent starting point to replace our outdated and unsustainable FFS primary care payment system and accelerate comprehensive primary care delivery.
Acknowledgments
The authors recognize the support of Health Data Decisions, and specifically John Hoff, who was instrumental in building the Comprehensive Primary Care Payment Calculator. They also to give special thanks to Stan Borg, DO, project leader; and CFAR for coordinating the efforts of the Payment team on this project. This project could not have been completed without the input, time, and review of the Family Medicine for America’s Health Payment Core Team: Thomas Weida, MD (core team leader); Stan Borg, DO; Steven Kamajian, DO; Rebecca Malouin, MS, MPH, PhD; Paul Martin, DO; Karen Smith, MD; Bruce Bagley, MD and Matthew Harker, MPH, MBA.
Portions of this study were presented at the following conferences:
STFM Annual Spring Conference May 6, 2018, Washington DC;
STFM Conference on Practice Improvement, December 1, 2017, Louisville, KY;
STFM Annual Spring Conference, May 5, 2017, San Diego, CA.
References
- Hoff J. Comprehensive Primary Care Payment Background Report. Family Medicine for America’s Health. May 2017. http://fmahealth.org/wp-content/uploads/2017/09/FMAHealth-CPCP-Background-Report-May-2017-Internal-Distribution.pdf. Accessed October 16, 2018.
- Family Medicine for America’s Health. Payment Tactic Team. https://fmahealth.org/payment-tactic-team/. Accessed November 8, 2018.
- Gold SB, Park BJ. Effective payment for primary care: an annotated bibliography. (Draft Report distributed at Starfield Summit, 2016. http://static1.squarespace.com/static/56bb9997746fb9d2b5c70970/t/57152c80d210b8258fee198b/1461005441994/Annotated+Bibliography+-+Payment_FINAL.pdf. Accessed October 16, 2018.
- Hoff J. Comprehensive Primary Care Payment Methodological Brief. Family Medicine for America’s Health. June 2017. http://fmahealth.wpengine.com/wp-content/uploads/2017/08/FMAHealth_CPCP_Methodology_June_2017.pdf. Accessed October 16, 2018.
- Family Medicine for America’s Health. Working Definition of Comprehensive Primary Care Payment. Sept 2017. http://fmahealth.wpengine.com/wp-content/uploads/2017/08/FMAHealth_Working_Definition_CPCP_170811.pdf. Accessed October 16, 2018.
- Frits Huyse C-L. Minnesota Complexity Assessment Method [Adapted by Peek, Baird, Coleman, and DFMCH faculty]. 2009. https://www.familycarenetwork.com/sites/default/files/MCAM%20Tool-ver%202.pdf. Accessed October 16, 2018.
- Kind AJH, Jencks S, Brock J, et al. Neighborhood socioeconomic disadvantage and 30-day rehospitalization: a retrospective cohort study. Ann Intern Med. 2014;161(11):765-774. https://doi.org/10.7326/M13-2946
- Center for Medicare and Medicaid Services. Consensus Core Set: ACO and PCMH Primary Care Measures Version 1.0. Feb 2016. https://www.cms.gov/Medicare/Quality-Initiatives-Patient-Assessment-Instruments/QualityMeasures/Downloads/ACO-and-PCMH-Primary-Care-Measures.pdf. Accessed October 16, 2018.
- Peikes D, Dale S, Ghosh A, et al. The comprehensive primary care initiative: effects on spending, quality, patients, and physicians. Health Aff (Millwood). 2018;37(6):890-899. https://doi.org/10.1377/hlthaff.2017.1678
Lead Author
Aaron George, DO
Affiliations: Department of Family and Community Medicine, Penn State College of Medicine, Hershey, PA
Co-Authors
Neha Sachdev, MD
John Hoff, BA - Health Data Decisions, Boston, MA
Stanley Borg, DO - Borg Associates, Chicago, IL
Thomas Weida, MD - University of Alabama College of Community Health Sciences, Tuscaloosa, AL
Malachi O'Connor, PhD - CFAR, Inc, Philadelphia, PA
Kisha N. Davis, MD, MPH - CFAR, Inc, Philadelphia, PA
Corresponding Author
Aaron George, DO
Correspondence: 19902 Ashfield Court, Hagerstown, MD 21742. 717-658-3958. Fax: 301-665-4521.
Email: aaronegeorge@gmail.com
Fetching other articles... 
Loading the comment form...
Submitting your comment...

There are no comments for this article.