Background and Objectives: The primary goal of family medicine residency training is for graduates to provide high-quality, safe, and effective patient care for the population they serve when they enter practice. This study explores (a) the practice profiles, 5 years into practice, of residents who completed family medicine training in Ontario, Canada; and (b) relationships between performance on the College of Family Physicians of Canada’s (CFPC) Certification Examination in Family Medicine and quality of care provided 5 years into practice.
Methods: We performed a retrospective study with secondary data analysis. We merged CFPC examination data sets with the ICES (Institute for Clinical Evaluative Sciences) administrative database. We included physicians who passed the examination between the years 2000 and 2010 and practiced in Ontario after graduation. Practice profile indicators included practice type, continuity and comprehensiveness of care, patient rostering and panel size, and rurality index. We explored 11 indicators related to management of diabetes and cancer screening.
Results: We included a total of 1,983 physicians in the analyses. Five years after the examinations, 74.3% of the physicians were working in major urban centers, and 67.3% of the physicians were providing comprehensive primary care. We noted significant differences across the six medical schools in multiple practice profile indicators, and three indicators showed significant differences across the examination score quintiles.
Conclusions: Graduates of Ontario family medicine residency programs were providing care to a broad spectrum of the population 5 years after passing the examination, and they performed similarly across quality-of-care indicators regardless of examination scores.
The primary goal of medical residency education is for trainees (residents) to attain competence to provide high-quality, safe, effective, unsupervised patient care when they enter practice. The decision regarding whether residents are ready for independent practice is made based on a combination of in-training assessments and end-of-training examinations. In Canada, the College of Family Physicians of Canada (CFPC) sets the national standards for training and certification in family medicine, including accrediting family medicine residency programs and setting the certification examination. The goal of the examination is to provide assurance that successful candidates meet the profession’s knowledge and skills expectations in family medicine.
Evidence to date correlating physician examination scores and quality of care physicians provide in practice is mixed. Tamblyn et al in 1998 showed a positive correlation between scores on family medicine certification examinations and indices related to preventive care and chronic disease management during the first 18 months following practice entry.1 Physicians who achieved higher scores were more likely to refer women aged 50 to 59 years for mammography screening, to prescribe more disease-specific medications and fewer general symptomatic and contraindicated medications, and to refer more of their patients for consultation, than physicians with lower scores. A follow-up study in 2002 found scores achieved on certification and licensing examinations taken at the end of family medicine training showed a sustained relationship, over 4 to 7 years, with indices of preventative care and chronic disease management in practice.2
Family medicine residency training programs should prepare residents to respond to the needs of the communities they serve.3,4 This requires programs to offer training that enables residents to work in different sized communities and with different populations. Moreover, residency training should provide learning experiences that reflect the comprehensive scope of practice of family medicine, the provision of continuity of care, and the differing levels of illness acuity. Practice profiles (including scope of practice), care across the life cycle (including maternal and neonatal care, pediatrics, care of the elderly, and palliative care), practice settings (office, hospital, long-term care), and models of care, reflect continuity and comprehensiveness.
In Canada, family medicine residency training is a 2-year program. Within the province of Ontario, all six residency programs offer urban and rural training streams, but one school has a specific mandate to prepare graduates for rural-based practice. Certification in family medicine requires readiness to take the examination, as assessed by ongoing in-training assessments, and successfully passing the CFPC examination. Physicians already in practice can be certified via a practice eligible route and successfully taking the examination. Once certified by the CFPC, in order to practice, physicians must then receive a practice license from the Colleges of Physicians and Surgeons of their respective provinces.
The CFPC holds its family medicine residency examinations twice a year (spring and fall). Most residents sit the examination at the spring administration, whereas the fall examination is more often taken by physicians eligible for examination via the practice route, including international graduates.
Each examination features different questions, collated from a large pool of questions developed by the CFPC’s examination committee. The examination assesses four main areas of competence in clinical reasoning: diagnosis, management, prevention, and communication. The examination has two parts. The first is a 6-hour-long, written examination called the Short Answer Management Problems (SAMPs) and the second is a practical examination of five 15-minute office-based simulations, called the Simulated Office Oral (SOO) examination. The CFPC uses a normative (norm-referenced) approach for setting the pass-fail mark for each examination. The reference group, by which the pass-fail mark is established, consists of residents taking the examination for the first time. The raw examination scores are transformed into standardized Z scores. Conceptually, the exam is designed to distinguish pass from fail, however the examination produces several continuous scores that provide an opportunity to explore the predictive capability of the examination.
The CFPC undertook this study as part of its residency-training continuous improvement work to (a) describe practice profiles of graduates 5 years into practice, and (b) to explore whether performance on the family medicine residency examination is associated with the quality of care later provided in practice.
Overall Study Design
We undertook a retrospective study of residents who completed a family medicine residency in Ontario, were successful on their examination between 2000 and 2010 inclusive, and were practicing in Ontario 5 years after graduation. We included spring and fall examination sittings for each year, resulting in 22 subcohorts.
Exclusion criteria included failing results in the examination and individuals who could not be linked via the College of Physicians and Surgeons (CPSO) physician database. The CPSO is the provincial medical regulatory authority that licenses physicians to practice in the province, and each clinician with a license receives a unique CPSO number, which was used to link the databases. Lack of linkage with the CPSO database precluded linkage with administrative databases. Candidates who applied to sit the examinations via the practice-eligible route represented 0.4% of all examination candidates and were excluded from analyses.
We merged examination data sets held at the CFPC with several population administrative databases held at ICES (formerly known as the Institute for Clinical Evaluative Sciences). We identified all patients seen by the study cohort during their fifth year of practice in Ontario using fee-for-service Ontario Health Insurance Plan (OHIP) billing codes. For example, we studied the data of patients in 2015 for physicians who took their examination in 2010. Physicians in the examination’s spring sitting were assigned an index date of 31 March of that year, while fall graduates were assigned an index date of 30 September of that year. We used these index dates to determine their corresponding 5-years-into-practice patient cohorts.
Data Sources
The data sources included the examination and membership databases of the CFPC and several provincial administrative databases accessible by ICES5 Prior to the study, there was no connection between the CFPC and ICES databases, and so a goal of the study was to navigate the logistical, ethical, and legal requirements to merge these in a separate database. The ICES Data Repository consists of record-level, coded and linkable health data sets. It encompasses much of the publicly-funded administrative health services records for the Ontario population eligible for universal health coverage since 1986 (databases used are described in Appendix A at https://journals.stfm.org/media/4575/pereira-appendix-a.pdf).
Outcome Indicators
Practice Profile. Includes practice type, panel size, comprehensiveness of care, continuity of care, rurality index score (RIS), and patient rostering (see Appendix B at https://journals.stfm.org/media/4576/pereira-appendix-b.pdf). “Comprehensiveness” is defined based on the formula used by Schultz and Glazier and applies if more than half of services provided relate to core primary care and if these services fall into at least seven of 22 activity areas.9 Physicians with 50% or less of their services for core primary care but with more than 50% in a single location or type of service were identified as being in focused practice.
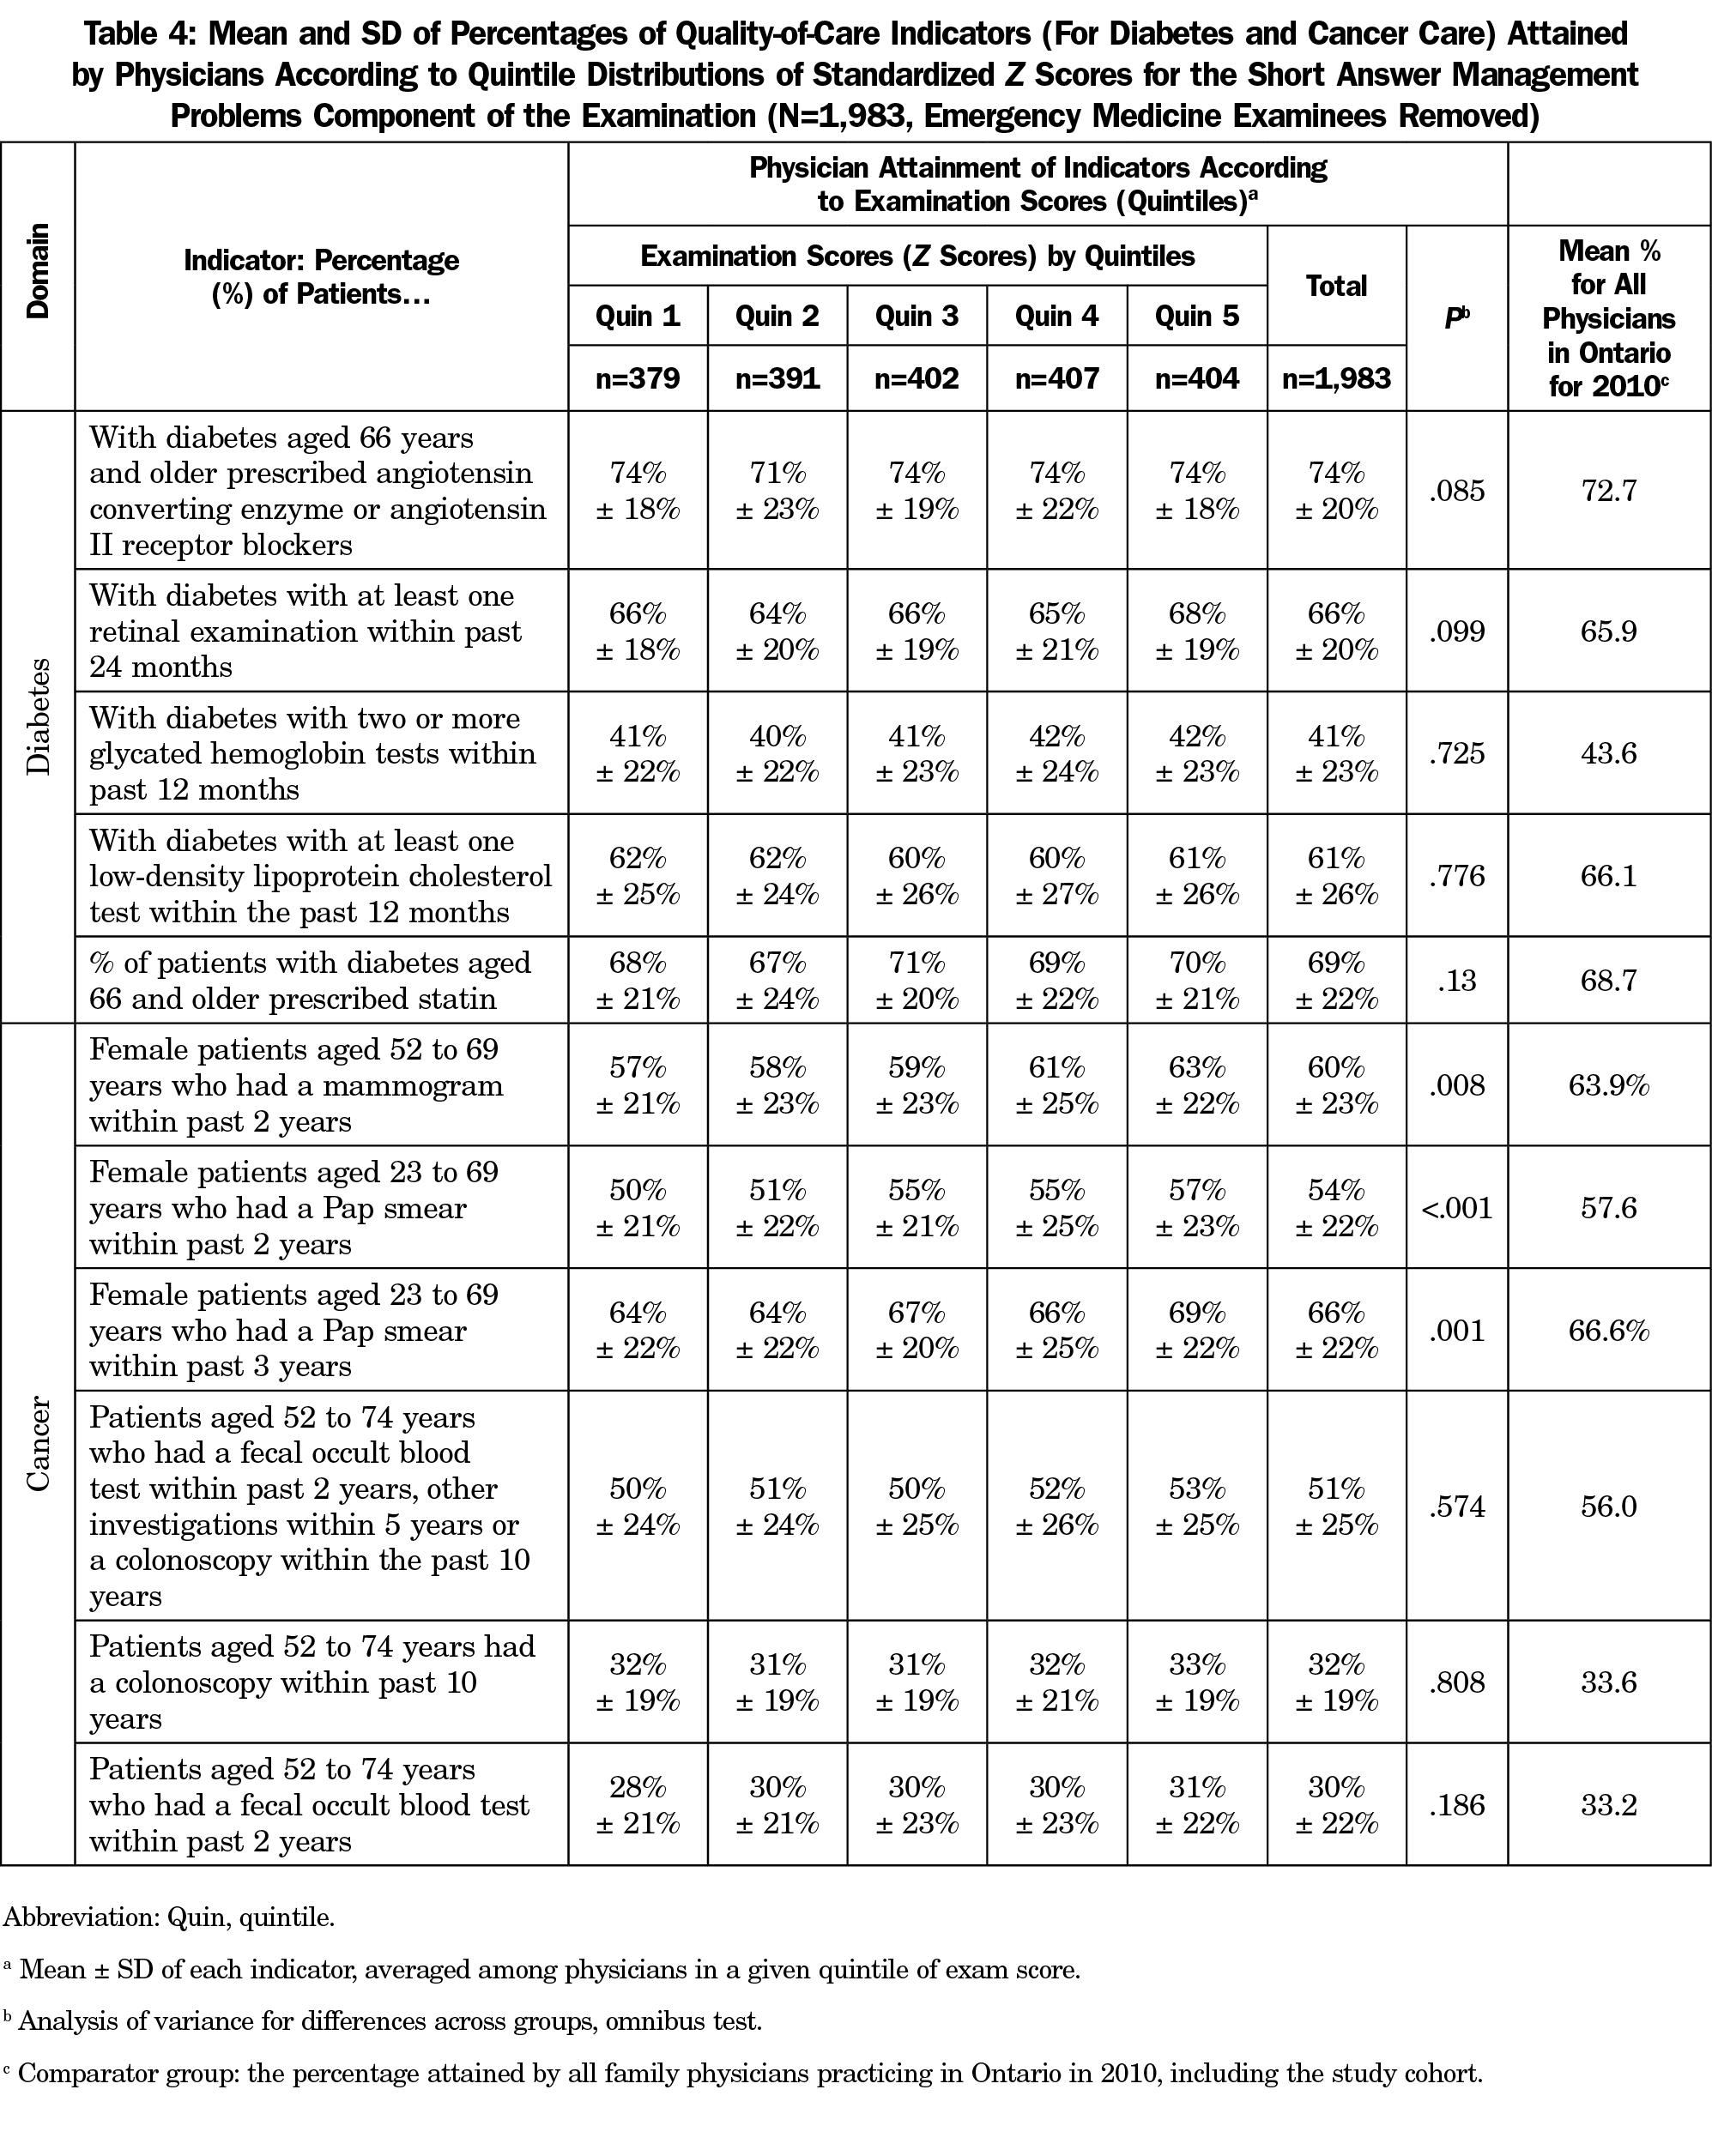
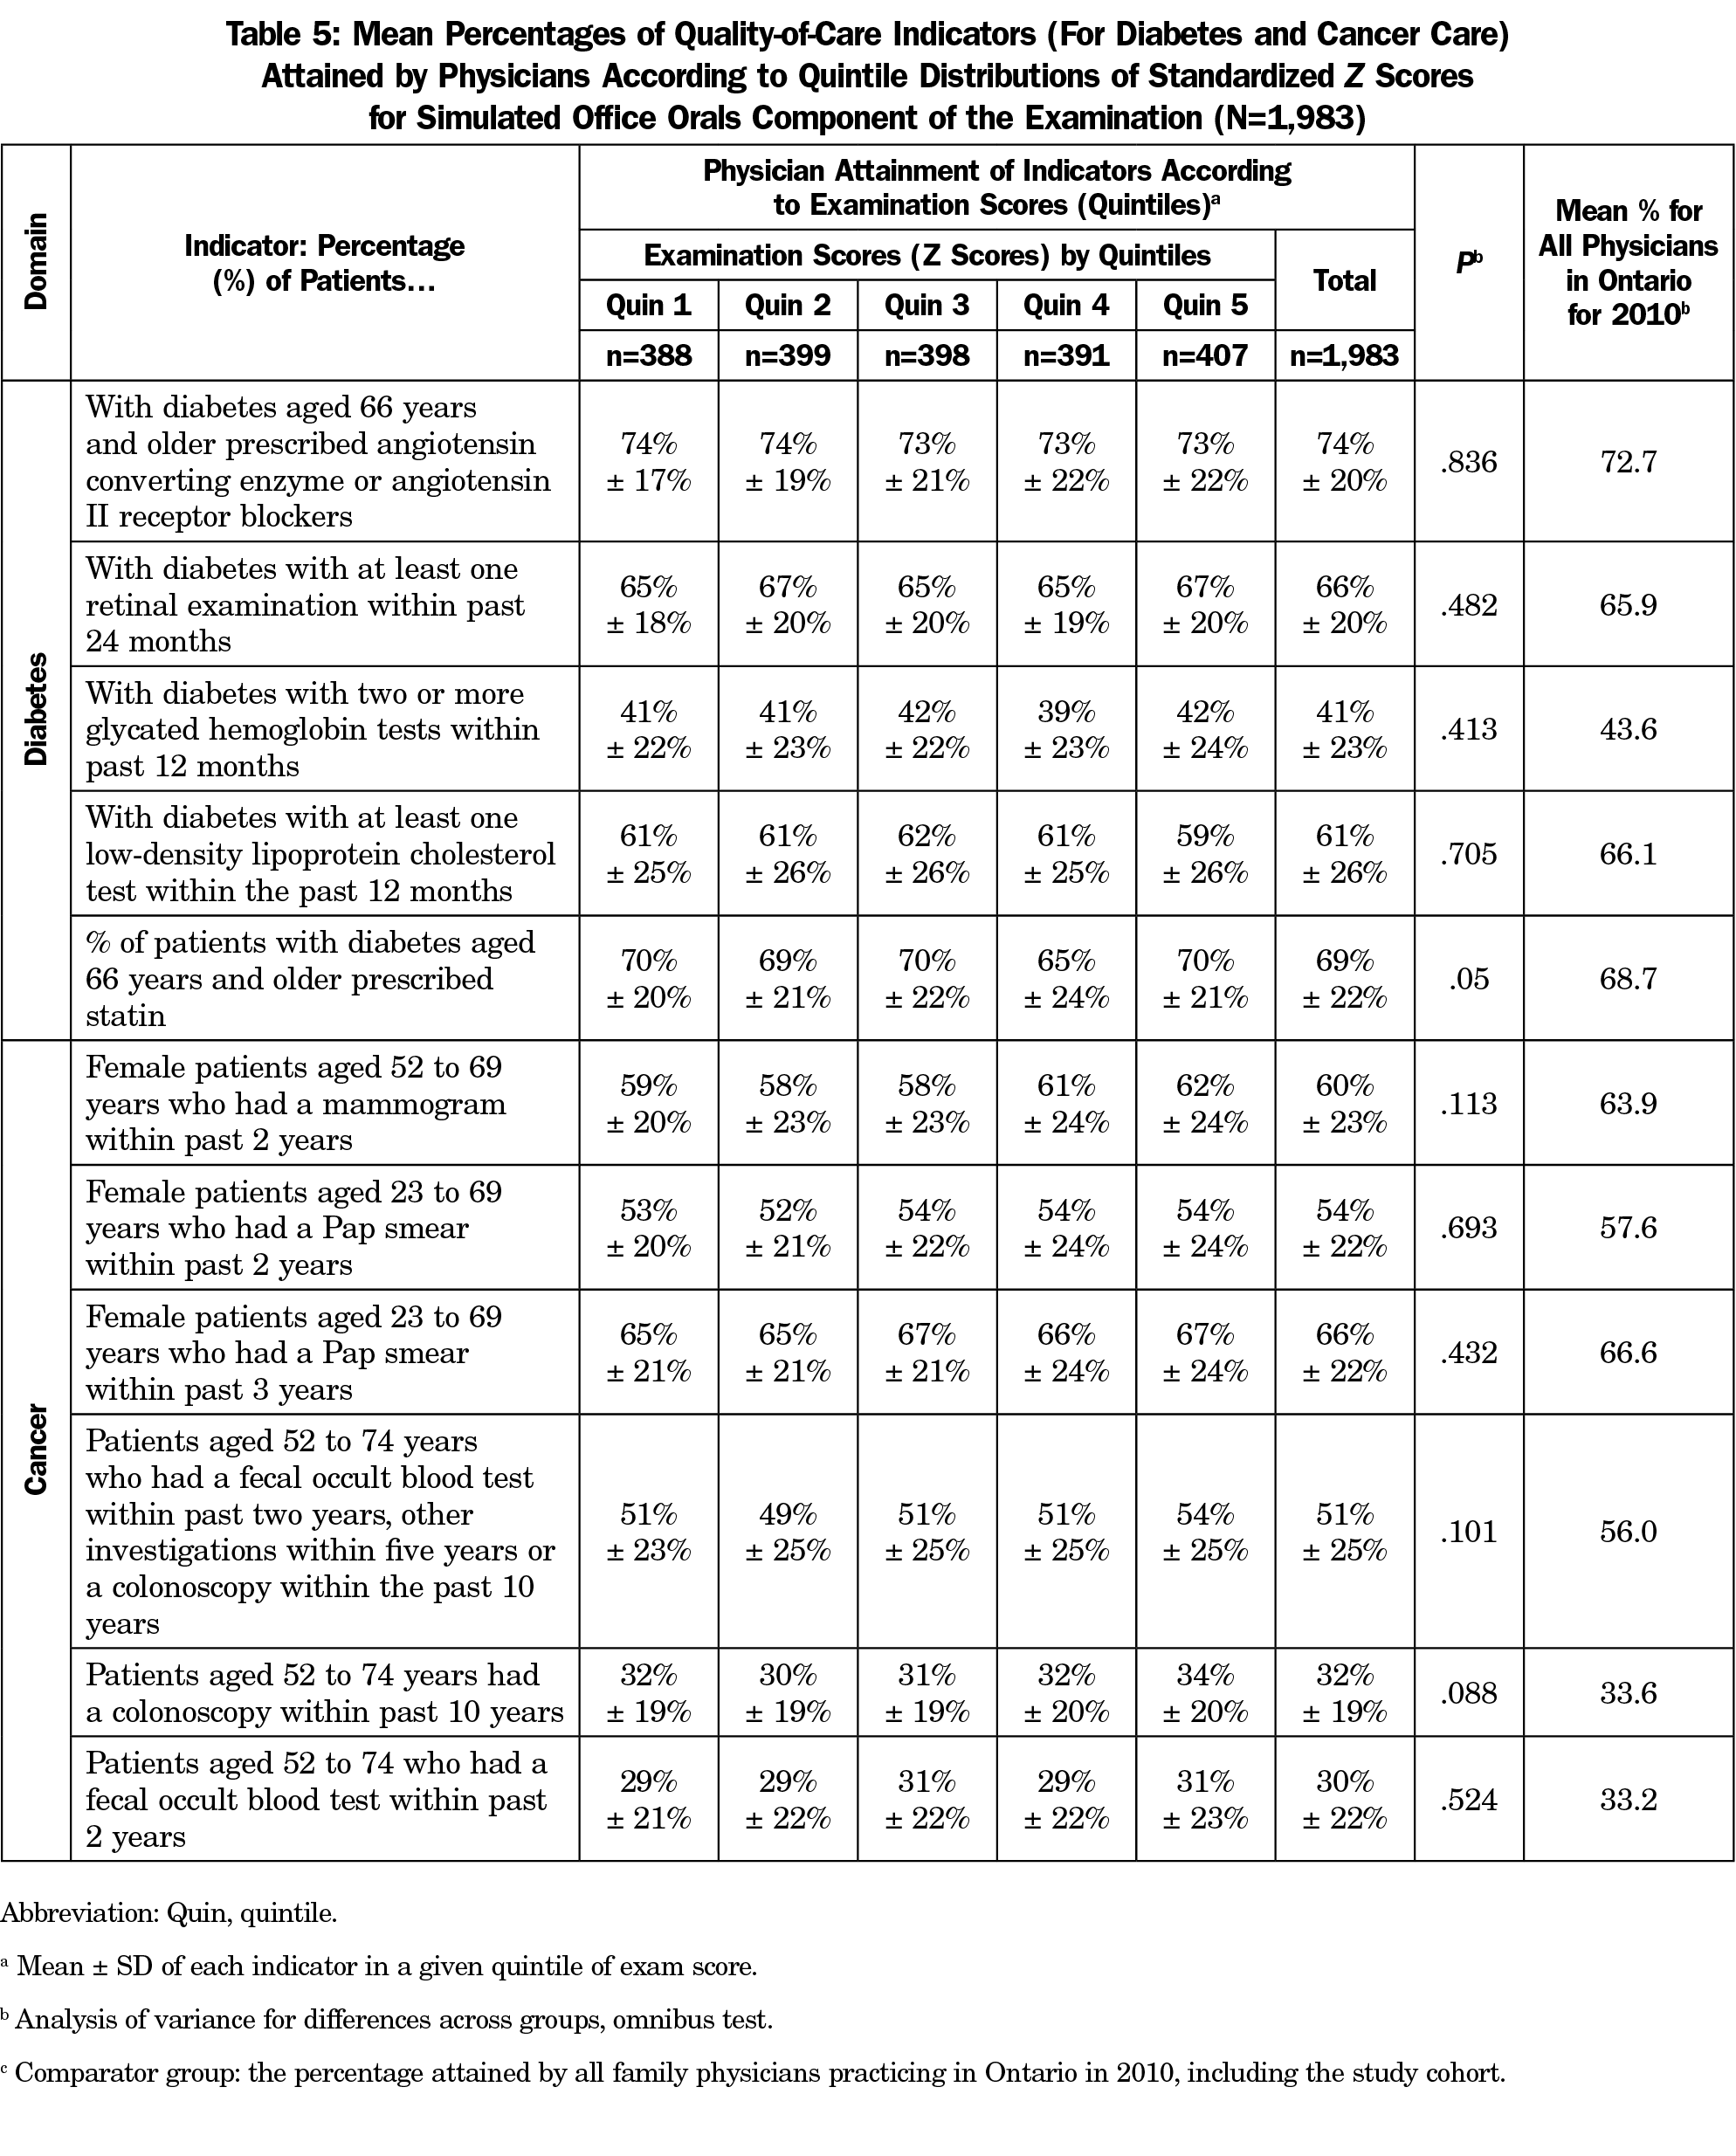
Quality of Care. We used six indicators related to the management of diabetes and seven indicators for cancer care as surrogate indicators of quality (see Appendix C at https://journals.stfm.org/media/4577/pereira-appendix-c.pdf). These indicators are used by Health Quality Ontario (HQO) and Cancer Care Ontario (CCO) in their provincial quality improvement activities (Tables 5 and 6).6
The Ontario Ministry of Health provides financial incentives for physicians who attain certain levels of the quality indicators, however there are no gold standards for the indicators. Given the absence of provincial standards, we used the mean percentage attained by all family physicians in the province of Ontario in 2010 (including the cohort results) as a comparator.
Analytical Methods
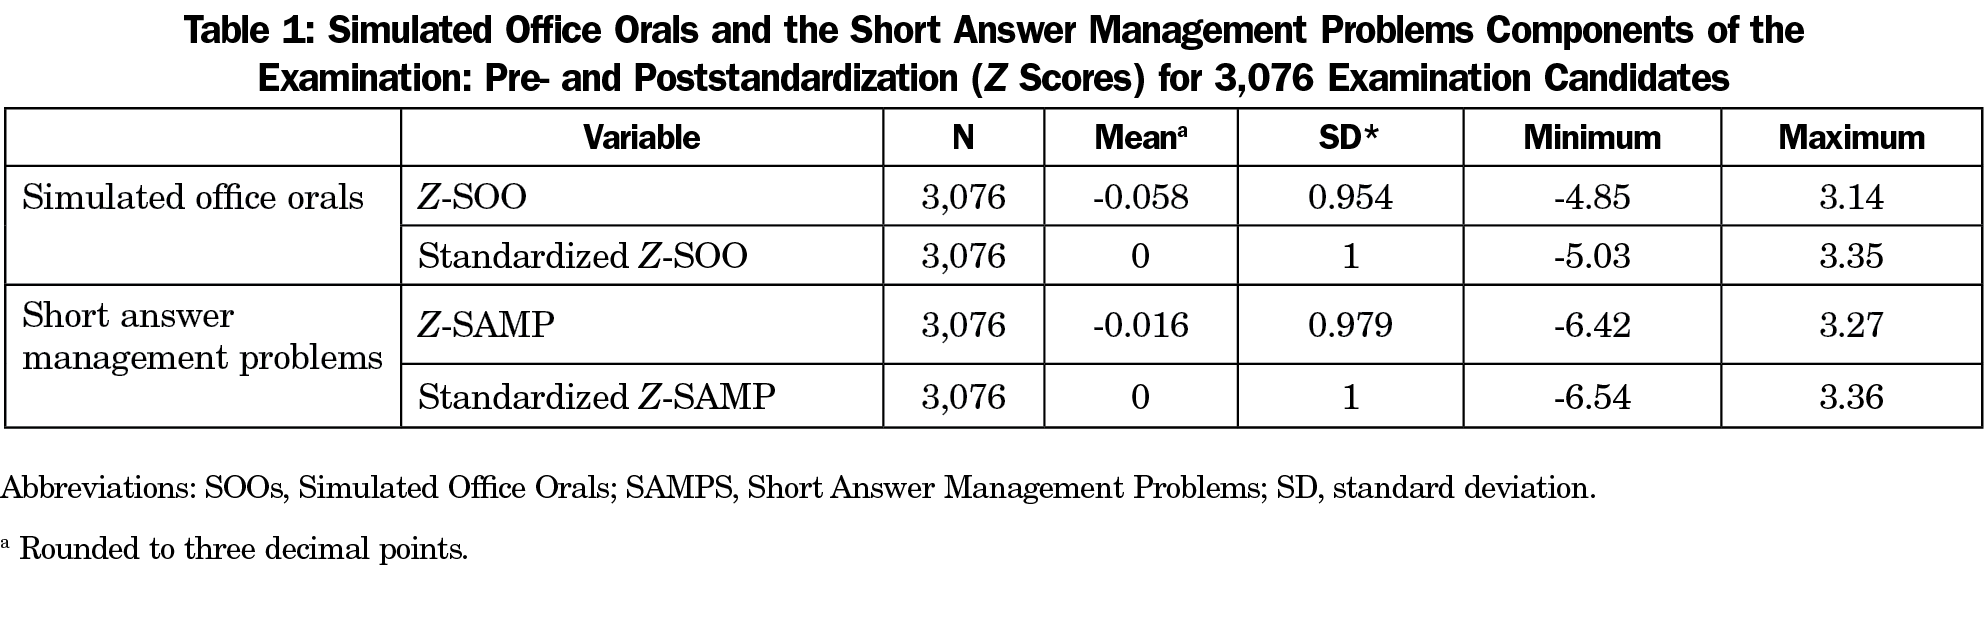
We used descriptive statistics to present the demographics of the study participants. The raw examination scores for both the SAMP and the SOOs have been converted to standardized Z scores for the purpose of setting pass/fail thresholds for each examination sitting. Both exam components (SOO and SAMP) values for each cohort were further standardized to allow comparison across all the cohorts. We confirmed that the double standardization had not reduced variability; variability had been retained and outliers were not lost. We categorized the cohort’s scores on the two components by quintiles.
To test differences across groups, we used the χ2 test for categorical data and analysis of variance (ANOVA) in the case of continuous data. We used ANOVA omnibus testing to compare means across groups. We set the significance level at P<.05. To ensure anonymity of the six departments of family medicine involved, we analyzed the six schools as a single collective and presented results in aggregate form or by ranges. The study was reviewed through the ICES research process (ICES Project No.: 2016 0900 836 000) and exempted from peer review by the Bruyère Research Ethics. All analyses were undertaken by ICES.
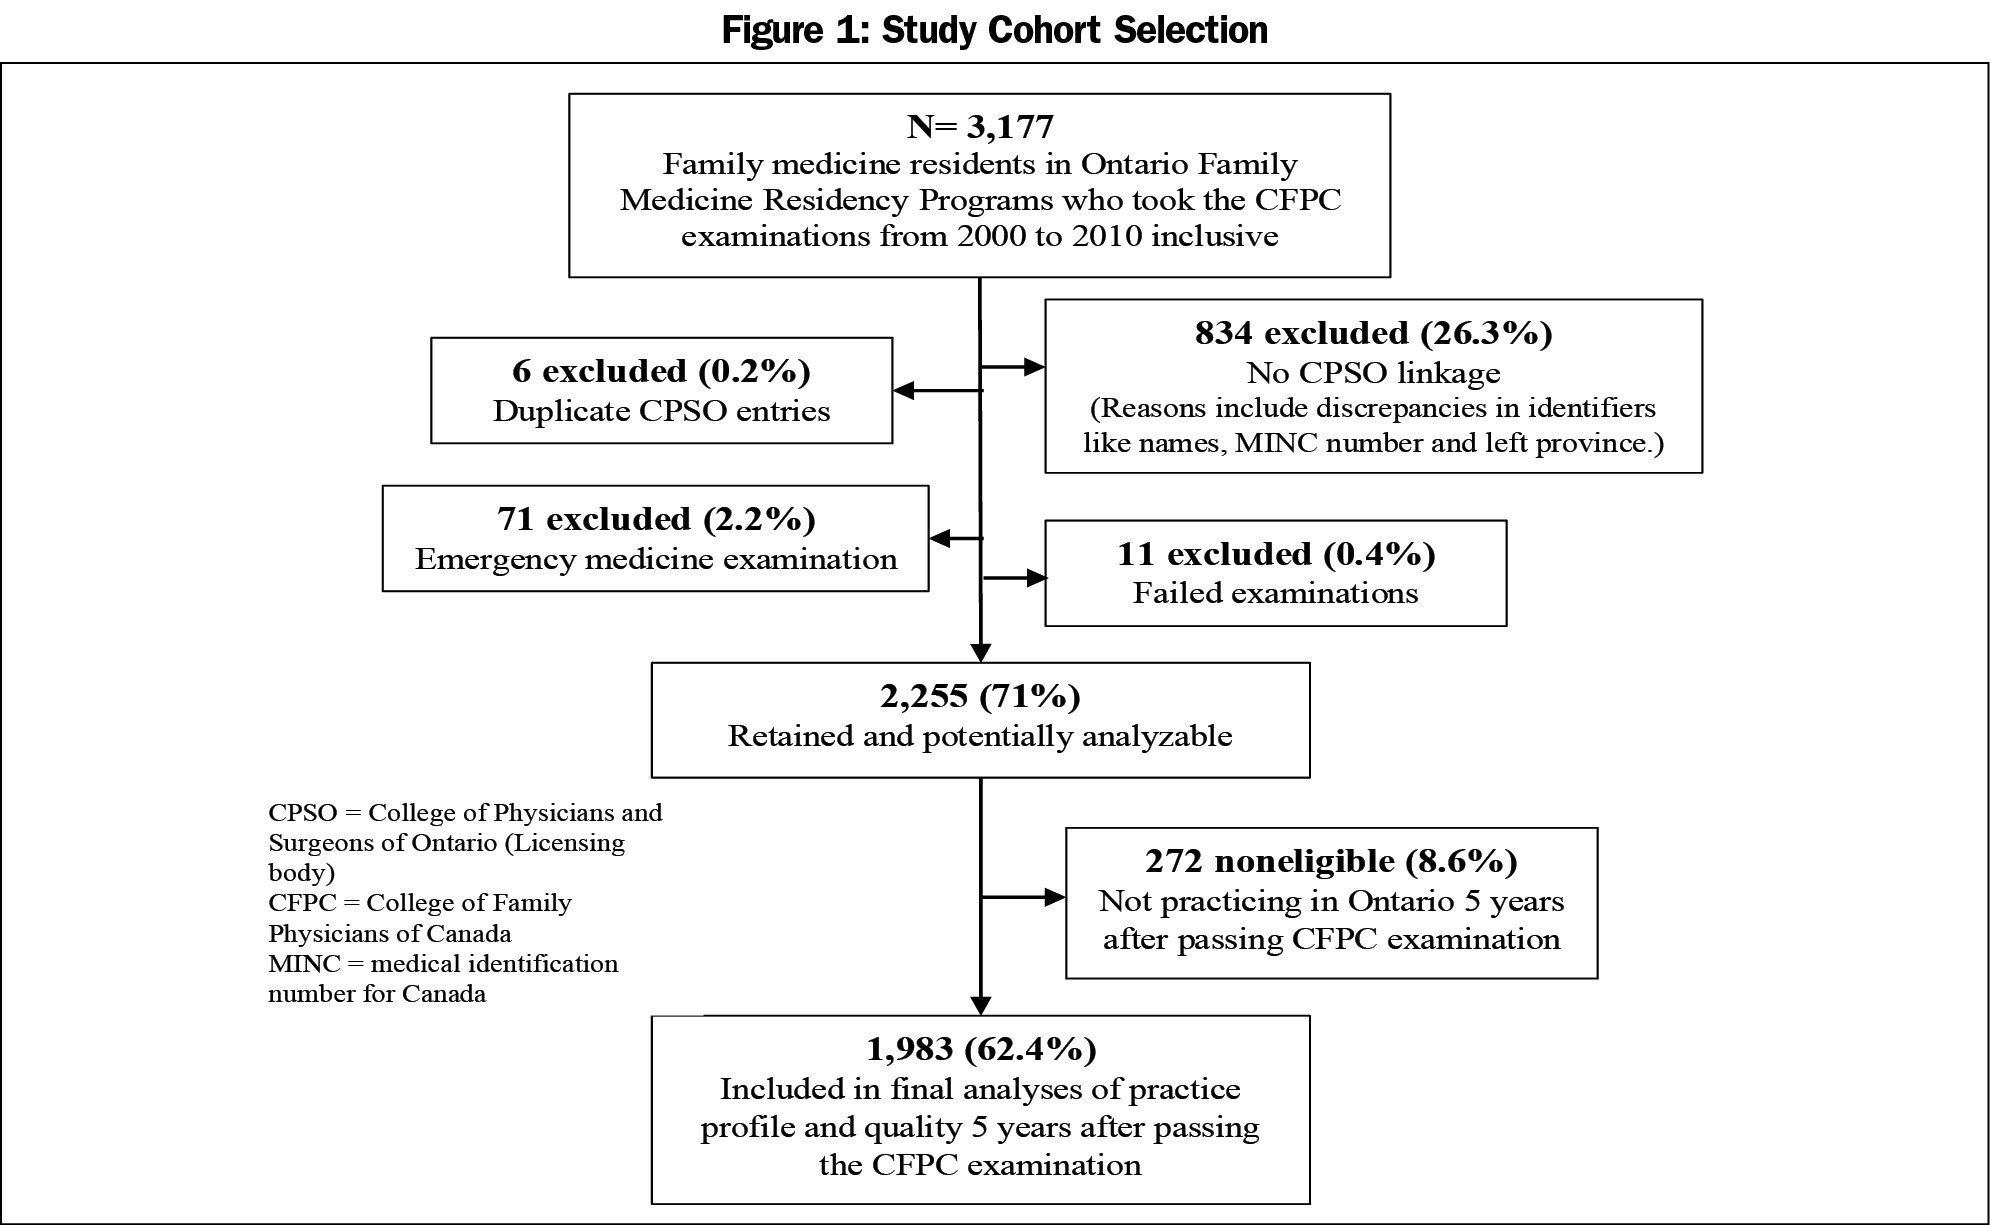
Study Cohort
We identified a total of 3,177 family medicine residents who completed residency programs in Ontario from 2000 to 2010 (Figure 1). After data linkage and application of exclusion and inclusion filters, there was a cohort of 2,255 physicians (71%) who were potentially analyzable. We excluded a further 272 physicians because they were not practicing in Ontario 5 years after the examination (ie, no billing information available). These individuals started practicing in Ontario after graduation (hence could be linked to a CPSO number), but there were no billing data in the administrative databases 5 years later, resulting in a cohort size of 1,983. A total of 834 examination candidates could not be linked to the CPSO database. The majority of the residents, 1835 of 2,255 (81.4%) took the examination in the spring sittings, and the majority of candidates passed the examination at first attempt (92.9%; see Appendix D at https://journals.stfm.org/media/4578/pereira-appendix-d.pdf for more information). The standardized scores (z scores) for the examination candidates are shown in Table 1.
Practice Profiles and Characteristics of Study Physicians
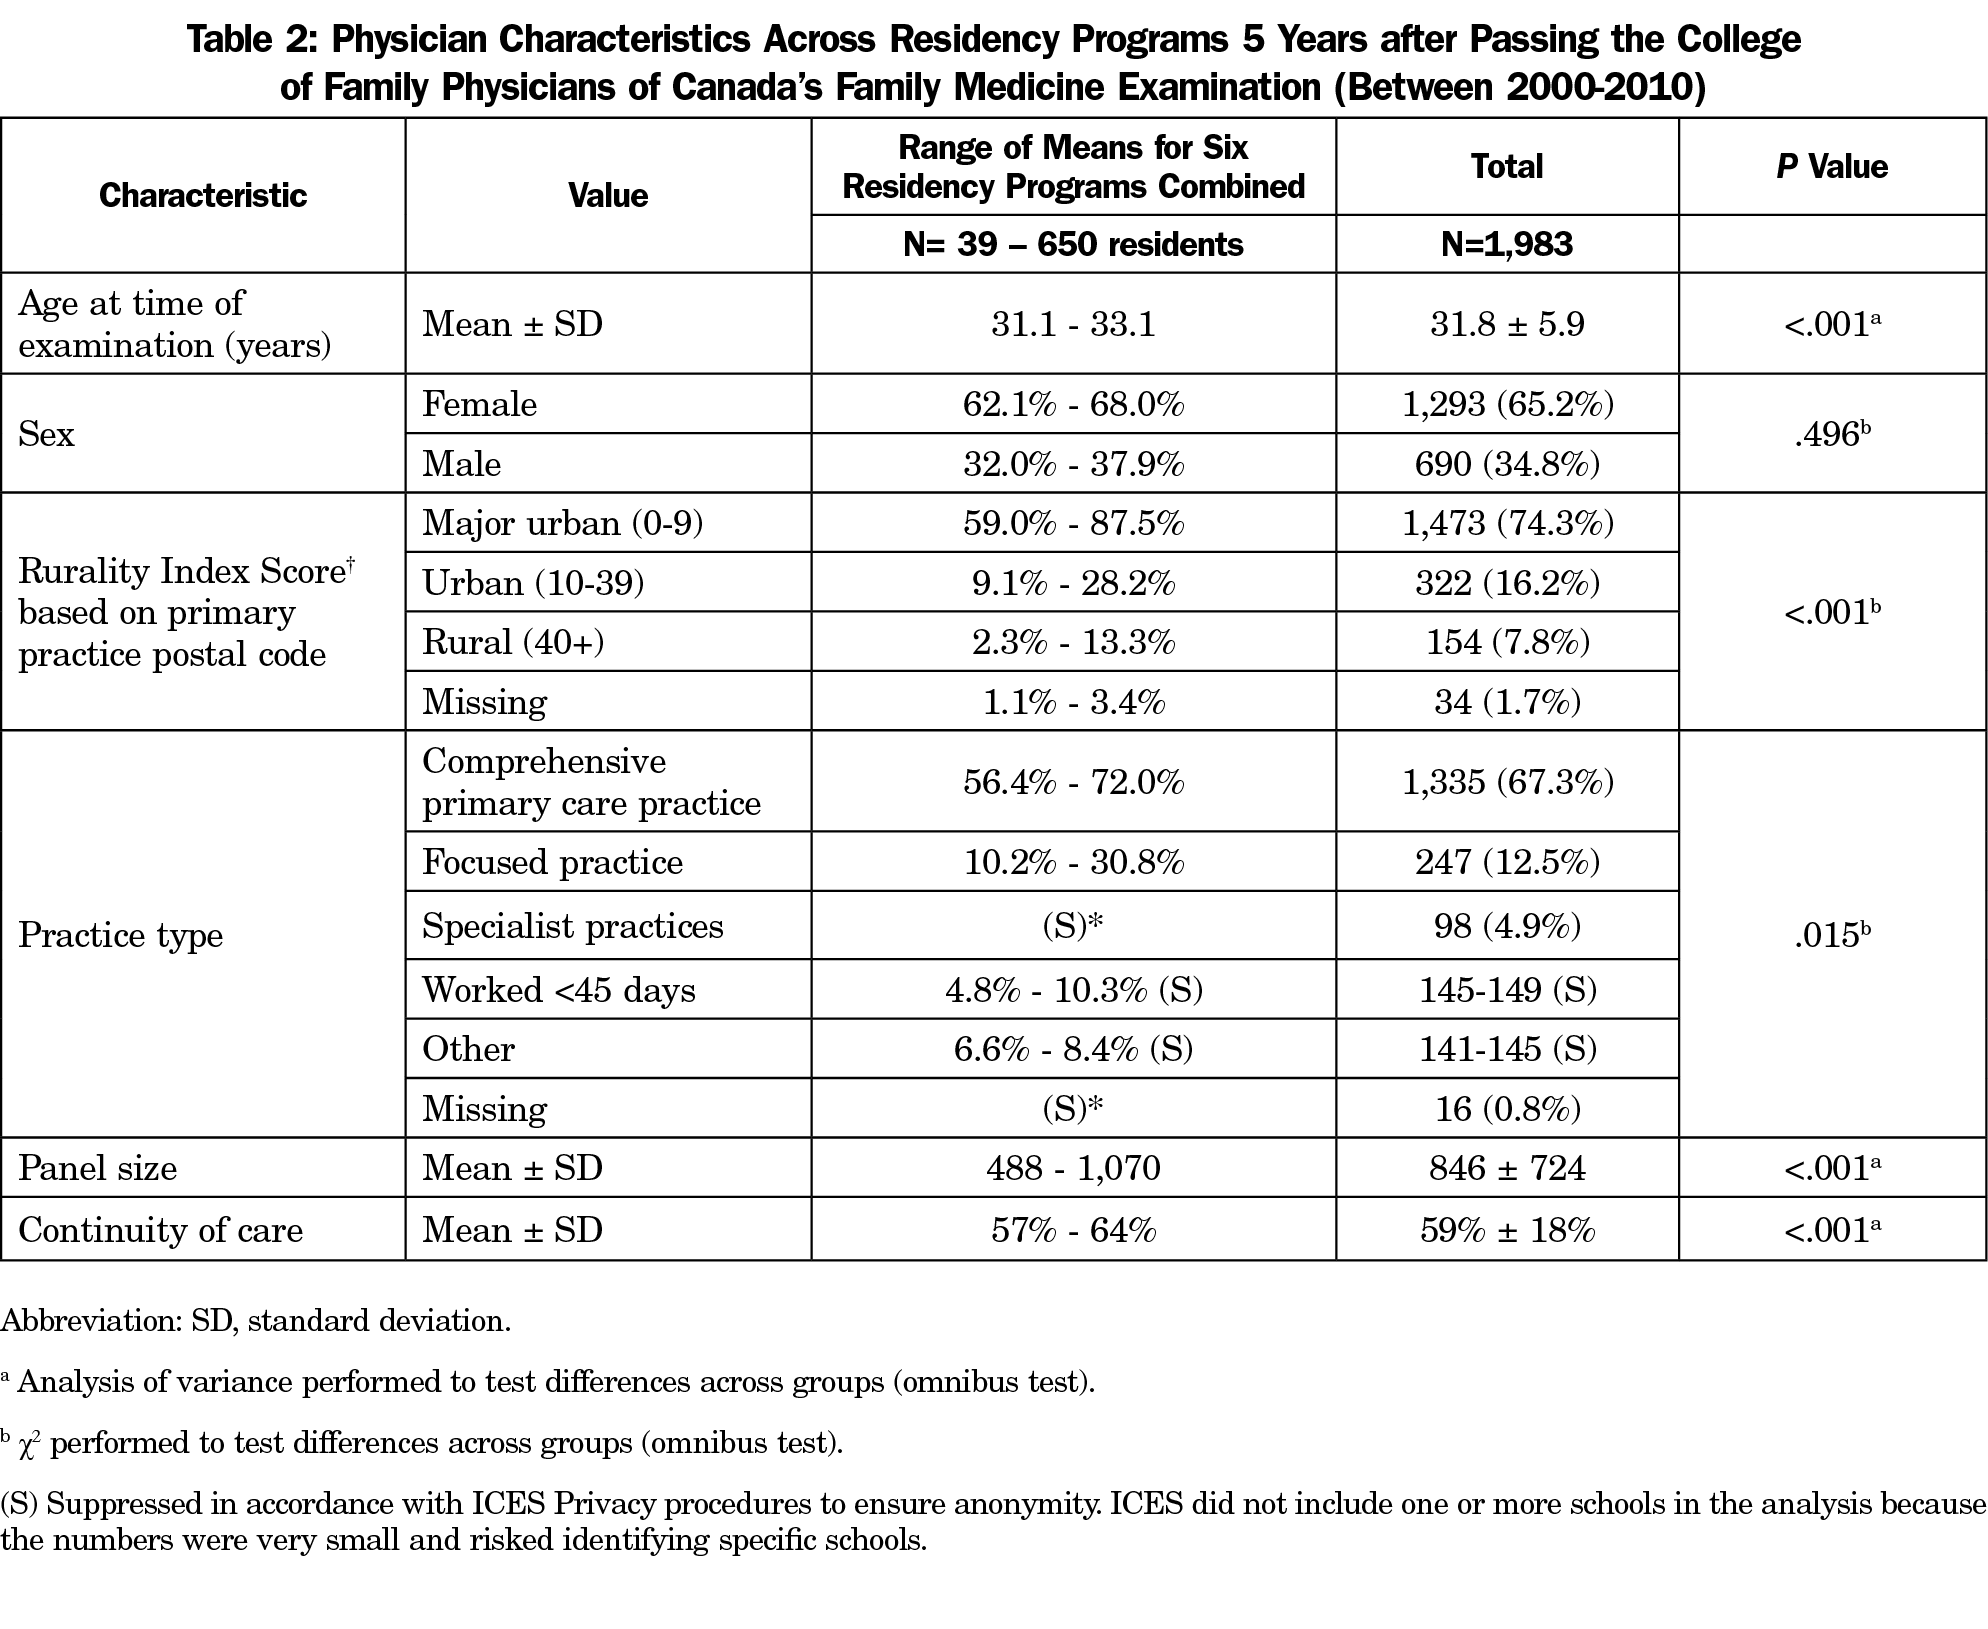
The mean ages of physicians across the schools at the time of success with the examinations ranged from 31.1 to 33.1 years (Table 2). The Rural Index Score (RIS) indicated that 1,473 (74.3%) of the sample were working in major urban centers, 322 (16.2%) in smaller urban centers, and 154 (7.8%) in rural areas. A statistically significant difference was noted between the schools in regards to the RIS. For example, 2.3% of graduates from one school were working in rural areas (the lowest proportion) while another school had 13.3% (the highest proportion) of graduates working in rural areas. Two-thirds (67.3%) of physicians were providing comprehensive primary care 5 years into practice (ranged across schools from 56.4% to 72%). A mean of 12.5% (ranged across schools from 10.2% to 30.8%) of physicians were working in focused practices. The differences across the schools for practice type (P=.015) and panel sizes (range=488 to 1,070, P<.001), and index for continuity of care (57% to 64%, P<.001) were all statistically significant.
Characteristics of Patients Being Cared for by Study Physicians
At 5 years, the characteristics of the patients rostered to the physicians varied considerably across the six schools (Table 3). Overall, physicians were caring for patients across the full range of age groups and income levels. We found significant differences across schools with respect to the rurality index scores of patients. The majority of participants (71.9%) had patients specifically rostered to them. An additional 16% had virtual rostering (ie, patients were not formerly rostered to the physician however they were the main provider determined by billing data), and 12.1% of physicians worked in practices with no rostering.
Quality Indicators
For the SAMP component of examinations, only three of eleven indicators, which were cancer screening-related indicators, showed statistically significant differences across examination score quintiles: mammograms performed on female patients aged 52 to 69 years within the past 2 years; Pap smears within the past 2 years for females aged 23 to 69 years; and Pap smears in the similar-aged group within the last 3 years (Table 4). Physicians who scored in the highest quintile in the examination attained higher indicator rates than those in the lowest quintile. The rates attained by the study cohort compared to the 2010 comparator group varied across the indicators.
For the SOOs examinations (Table 5), no statistically significant differences were noted between examination score quintiles and the indicators. The rates between the total cohort scores were similar to the comparator group across most of the indicators, with the exception of fecal occult blood testing within the past 2 years for patients aged 52 to 74 years, which was 51% ± 25% for the study cohort compared to 56% for the provincial average.
This study involving almost 2,000 physicians over a decade who completed family medicine residency training programs in Ontarian medical schools, explored practice profiles and quality performance in two areas, diabetes care and cancer screening, in their fifth year of practice. The results of this study reassuringly demonstrate that family medicine residency training in Ontario has produced physicians who are providing care across the province and they are providing care to the full spectrum of the population; across age groups, socioeconomic strata, and for vulnerable populations such as new arrivals in the province (including refugees and immigrants). These findings align with the social accountability mandate of medical schools.7,8
About two-thirds of the early-career physicians in this study were providing continuity of care (59%) and the majority were working in practice models that involve rostering of patients (71.9%). Approximately two-thirds (67.3%) of physicians were providing comprehensive practice, similarly to a previous 2014-2015 study by Schulz and Glazier.9 In primary care, relational continuity is linked with improved preventive care, reduced health services utilizations and hospitalization, reduced mortality, improved overall quality of care, increased satisfaction, improved self-management and treatment adherence, and cost savings.10 Overall, a smaller percentage (12.5%) of physicians were working in focused practices (eg, palliative care, emergency medicine), however this varied across schools, ranging from 10.2% to 30.8%.
Although collectively the schools appear to be addressing population needs, the variability across schools with respect to the practice profiles warrants reflection. Variability in care and practice indicators have previously been observed in Canada.11 A number of factors could contribute to this. Some variability can be expected as some schools specifically focus on meeting the needs of their respective communities, which may vary in certain domains such as urbanization and rurality. Further, new immigrants often settle in urban areas. Other factors that may explain the variability include education approach, residency settings (major urban center versus smaller community), and role modeling by clinical teachers.
The panel sizes found in the study cohort (mean 846 ± SD 724) are relatively small by Canadian standards, which are generally 1,400 patients for practice enrollment models.9 The small size may be explained by the fact that we did not limit physicians to full-time activity only or belonging to comprehensive models. Furthermore, study participants were in the early years of practice, still building their practices.
The impact of the education approach and training context has been identified by others. Chen et al noted that in the United States residents trained in high-spending centers went on to provide care that was associated with higher costs than those who trained in lower spending centers.12 Phillips et al replicated the earlier study with a larger cohort and added quality indicators, and found that the unadjusted, annual, per-beneficiary spending difference between physicians trained in high- and low-cost hospital service areas significantly different, and the difference remained significant after controlling for patient and physician characteristics.13 No significant relationship was found for diabetes quality measures between these centres and training programs and centres with more graduates in rural practice and primary care produced lower-spending physicians.
The number of residents working in rural regions aligns with Ontario’s rural population, namely about 14.1% of the population.14 There are many approaches to categorizing the size of communities and cities and defining rurality, each with its own strengths and limitations.15-18 There is general agreement that the realities related to providing health care to rural populations include an absence of economies of scale, long travel times, and challenges recruiting and retaining the rural health work force.
Examination results show no noticeable differences between higher scoring candidates and lower scoring candidates for the quality-of-care indicators at 5 years, which aligns with the intent and design of the examination to distinguish between pass and fail candidates. However, this result prompts further reflections on the design and role of the examination. With the emergence of competency-based curricula for residency in the last decade, and the growing importance of programmatic assessments, reliance on the final examination is diminishing as a method of determining competency.19-21
This study provided an opportunity to explore relationships between examination scores and quality care indicators. While it is reassuring that those who pass with lower scores are providing similar care to those with higher scores, this study does not fully address whether these groups are meeting quality care standards. There are no evidence-based standards to compare these rates against, and physician performance cannot be solely predicted by examination scores. Yen and Thakkar found that age, sex, specialty, and examination scores influenced clinical performance.22 Years in practice (more years correlating with poorer performance), workload, and solo practice were additional factors.
The study’s comparator group, physicians in practice in Ontario in 2010, provided an opportunity to start exploring approaches to assessing clinical performance and associations with residency training. HQO and CCO started to improve standards across the indicators in the mid-2000s, therefore many of the physicians in this study were at the beginning of these initiatives and the full impact of the initiatives were not observed yet.
Limitations
This study has several limitations. The study cohort represents 62.4% of the whole potential study population. While not ideal, we believe it is large enough to allow for generalizability. We did not make adjustments for multiple comparisons. Multiple comparisons increase the probability of false positive tests of significance. The examination is designed to determine pass or fail, so the quintile categorization of the examination scores must be interpreted with caution. Quality of care was limited to only two domains (cancer screening and diabetes care). Performance in these areas cannot be generalized to other domains of care. Some of the indicators themselves are open to debate, as is the nature of quality scores. Some of the constructs studied, such as comprehensiveness, continuity, and rurality, are complex and the methods used did not necessarily capture the full multidimensionality of these constructs. In addition, fee-for-service billing codes do not account for all patient-visits and interactions.
The study assumes equivalence of the exams across the 11 years of the study based on regular psychometric analyses that the CFPC conducts on the examinations that indicate a high degree of consistency across the years. We did not apply equating techniques such as the nonequivalent groups with anchor test (NEAT) method or pseudo-equivalent group (PEG) linking, to produce interchangeable and comparable scores on different test forms.23,24 The study did not apply case-mix methods to account for variations in the graduates’ rostered populations given the exploratory nature of this work, which included exploring the feasibility of merging CFPC and large population databases. Future studies should include regression analyses to control for potential influences of various factors including differences across the schools. However, residents entering and completing family medicine residency across Canada may represent a relatively homogenous group in terms of ability, motivation, and medical school training, potentially reducing variability in the examination scores and later clinical performance.
Lastly, the relatively short family medicine residency training in Canada (2 years) should be considered when interpreting the results relative to other jurisdictions that have longer residency programs.
The results of this exploratory study show that the family medicine graduates were providing care reflective of comprehensiveness and continuity to a broad spectrum of the population 5 years after graduating. The variations in the practice profiles and characteristics found across the six medical schools warrants further analyses and exploration.
Several of the study’s findings merit further study and work. Future work should specify the optimal standards for these indicators, considering variables such as practice context and setting, and assess performance compared to those standards. The relatively low scores attained with some of the indicators need to be explored further. Future studies should also explore trends over time related to characteristics of practice and quality indicators to determine whether changes are occurring and if so, in which directions and why.
Importantly, by establishing the procedures to connect examination databases with population health databases, this study informs the CFPC’s ongoing quality improvement efforts. Understanding the factors that influence these parameters is important for educators and health workforce planners.
Acknowledgments
The authors acknowledge the following individuals for their contributions to the various stages and aspects of this study: Lawrence Grierson, Roland Grad, Brent Kver, and Brian Hess, for their input and insights into helping understand the study findings and preparing the manuscript; members of the study advisory group, including Steven Wetmore (Western University and Chairs representative), Alison Eyre (University of Ottawa), Douglas Archibald (University of Ottawa and coinvestigator), Joe Eibl (North Ontario School of Medicine), John Gallinger (CARMS), Roland Grad (McGill University- observer), Erin Graves (ICES), Lawrence Grierson (McMaster University, Chair), Karl Iglar (University of Toronto), and Karen Schultz (Queen’s University); and members of the administrative team who supported the work, including Deirdre Snelgrove (Research Department, CFPC) and Lorelei Nardi (Education Department, CFPC). The authors also thank Drs Pam Eisener-Parsche and Carlos Brailovsky for their input on the early conceptualizing of the study; and Lisa Ishiguro and Stefana Jovanovska for assistance in collating and analyzing the data at the Institute for Clinical Evaluative Sciences (ICES);
This study was supported by ICES, which is funded by an annual grant from the Ontario Ministry of Health and Long-Term Care (MOHLTC). The analyses, conclusions, opinions, and statements expressed herein are solely those of the authors and do not reflect those of the funding or data sources; no endorsement is intended or should be inferred.
Financial Support: This study was supported by way of in-kind funding by the College of Family Physicians of Canada (CFPC) and ICES (formerly known as the Institute for Clinical Evaluative Sciences). The investigators and the members of the advisory group participated by way of in-kind contributions. The study did not receive any external funding support.
Conflict Disclosure: While conducting this work, authors J.P., I.F.O., and D.K. were in the employment of the College of Family Physicians of Canada, and author E.G. was employed by ICES. The opinions, results, and conclusions are those of the authors and are independent of the CFPC, ICES, and Ontario Ministry of Health and Long-Term Care. No endorsement by the CFPC, ICES or the MOHLTC is intended or should be inferred. Some data were compiled and provided by other organizations, including the Canadian Institutes of Health Information (CIHI) and Cancer Care Ontario (CCO). However, the analyses, conclusions, opinions, and statements expressed in the material are those of the authors.
References
- Tamblyn R, Abrahamowicz M, Brailovsky C, et al. Association between licensing examination scores and resource use and quality of care in primary care practice. JAMA. 1998;280(11):989-996. doi:10.1001/jama.280.11.989
- Tamblyn R, Abrahamowicz M, Dauphinee WD, et al. Association between licensure examination scores and practice in primary care. JAMA. 2002;288(23):3019-3026. doi:10.1001/jama.288.23.3019
- Buchman S, Woollard R, Meili R, Goel R. Practising social accountability: from theory to action. Can Fam Physician. 2016;62(1):15-18.
- Schofield A, Bourgeois D. Socially responsible medical education: innovations and challenges in a minority setting. Med Educ. 2010;44(3):263-271. doi:10.1111/j.1365-2923.2009.03573.x
- ICES Data. ICES.Accessed November 18, 2020. https://www.ices.on.ca/Data-and-Privacy/ICES-data
- Health Quality Ontario (HQO) Indicator Library. Health Quality Ontario. Accessed November 22, 2020. http://indicatorlibrary.hqontario.ca/Indicator/Search/EN
- Buchman S, Woollard R, Meili R, Goel R. Practising social accountability: from theory to action. Can Fam Physician. 2016;62(1):15-18.
- Woollard RF. Caring for a common future: medical schools’ social accountability. Med Educ. 2006;40(4):301-313. doi:10.1111/j.1365-2929.2006.02416.x
- Schultz SE, Glazier RH. Identification of physicians providing comprehensive primary care in Ontario: a retrospective analysis using linked administrative data. CMAJ Open. 2017;5(4):E856-E863. doi:10.9778/cmajo.20170083
- Evidence Summary: The Benefits of Relational Continuity in Primary Care. Alberta Medical Association. October 2017. Accessed November 22, 2020. https://actt.albertadoctors.org/file/top--evidence-summary--value-of-continuity.pdf
- Monette J, Tamblyn RM, McLeod PJ, Gayton DC, Laprise R. Do medical education and practice characteristics predict inappropriate prescribing of sedative-hypnotics for the elderly? Acad Med. 1994;69(10)(suppl):S10-S12. doi:10.1097/00001888-199410000-00026
- Chen C, Petterson S, Phillips R, Bazemore A, Mullan F. Spending patterns in region of residency training and subsequent expenditures for care provided by practicing physicians for Medicare beneficiaries. JAMA. 2014;312(22):2385-2393. doi:10.1001/jama.2014.15973
- Phillips RL Jr, Petterson SM, Bazemore AW, Wingrove P, Puffer JC. The effects of training institution practice costs, quality, and other characteristics on future practice. Ann Fam Med. 2017;15(2):140-148. doi:10.1370/afm.2044
- Canada’s Rural Population Since 1851. Statistics Canada. February 2012 Accessed November 19, 2020. https://www12.statcan.gc.ca/census-recensement/2011/as-sa/98-310-x/98-310-x2011003_2-eng.pdf
- Ahmed W. Measuring Ontario’s Urban-Rural Divide. Ontario360. November 2019. Accessed November 19, 2020. https://on360.ca/policy-papers/measuring-ontarios-urban-rural-divide/
- Statistics Canada. Rural and Small Town Canada Analysis Bulletin. Vol 3, No 3. November 2001. Catalogue no. 21-006-XIE. Accessed September 29, 2021. https://www150.statcan.gc.ca/n1/en/pub/21-006-x/21-006-x2001003-eng.pdf?st=rXAvopn_
- Kralj B. Measuring Rurality - RIO2008_BASIC: Methodology and Results by the Ontario Medical Association. 2009 November 22, 2021. https://content.oma.org//wp-content/uploads/2008rio-fulltechnicalpaper.pdf
- Minore B, Hill ME, Pugliese I, Gauld T. Rurality Literature Review. Prepared for the North West Local Health Integration Network. Thunder Bay, Ontario: Centre for Rural and Northern Health Research Lakehead University. February 1, 2008. Accessed November 22, 2020. https://collections.ola.org/mon/24003/299628.pdf.
- Tannenbaum D, Kerr J, Konkin J, et al. Triple C competency-based curriculum. Report of the Working Group on Postgraduate Curriculum Review – Part 1. Mississauga, ON: College of Family Physicians of Canada; 2011.
- Oandasan I, Wong E, Saucier D, Donoff M, Iglar K, Schipper S. Triple C: linking curriculum and assessment. Can Fam Physician. 2012;58(10):1165-1167, e608-e610.
- van der Vleuten C, Lindemann I, Schmidt L. Programmatic assessment: the process, rationale and evidence for modern evaluation approaches in medical education. Med J Aust. 2018;209(9):386-388. doi:10.5694/mja17.00926
- Yen W, Thakkar N. State of the Science on Risk and Support Factors to Physician Performance: A Report from the Pan-Canadian Physician Factors Collaboration. J Med Regul. 2019;105(1):1-20. doi:10.30770/2572-1852-105.1.6
- Kolen M, Brennan R. Test equating, scaling and linking: Methods and Practice. (2nd Ed.) New York, NY: Springer; 2014.
- Haberman S. Pseudo-equivalent groups and linking. J Educ Behav Stat. 2015;40(3):254-272. doi:10.3102/1076998615574772