Background and Objectives: Physician scheduling affects job satisfaction and retention. This study explores how family medicine residency inpatient staffing relates to core faculty retention and program director (PD) perception of faculty satisfaction with work-life integration.
Methods: A total of 280 family medicine residency PDs responded to the 2023 Council of Academic Family Medicine Education Research Alliance survey. We used the ꭓ2 test to explore associations among program demographics, inpatient staffing characteristics, faculty retention, and PD-reported faculty satisfaction with work-life integration. We measured associations among pairs of ordinal variables with Spearman’s correlation.
Results: In two-thirds (66%) of programs, faculty cover the inpatient service at least every 8 weeks, with 40% of programs reporting averages of 70 or more hours per inpatient week; nevertheless, most programs’ faculty were perceived to be satisfied with less than 10% turnover. The number of hours per week was inversely associated with PD-reported faculty satisfaction (r=-0.21, P=.001). Faculty turnover was directly associated with community size (r=0.17, P=.01). Faculty turnover was more likely to be greater than 10% if the number of hours per inpatient week was more than 89 (odds ratio 12.4, P=.02). Faculty turnover, PD-reported faculty dissatisfaction, and plans to change inpatient staffing were all correlated (r>0.28, P<.0001).
Conclusions: Most family medicine residencies have core faculty cover the inpatient service at least once every 8 weeks, during which they work at least 60 hours per week. Longer hours are associated with lower perceived faculty satisfaction of work-life integration, with a threshold effect on faculty turnover. Family medicine residency programs must carefully balance the needs of residents, the community served, and faculty themselves.
Burnout and dissatisfaction with work-life integration affect nearly 50% of US physicians. 1 Long work hours, more overnight shifts, insufficient sleep, interrupted sleep, and insufficient sleep recovery contribute to physical fatigue, moral distress, and physician burnout. 2- 7 Inpatient services require staffing 24 hours per day, 7 days per week. Among family medicine residency programs is a wide array of inpatient staffing models for faculty. Family medicine inpatient services vary in patient load, scope of practice, level of autonomy granted to (ie, expected of) the covering resident(s), support from hospitalists and/or critical care unit (CCU) intensivists, and overlapping responsibilities while covering the service. While providing inpatient care, academic family physicians may simultaneously see outpatients, cover outpatient clinic call, provide obstetrics care, and/or manage other academic duties such as conducting meetings or attending to email.
Most of the literature studying physician work hours has focused on trainees, 8- 12 not faculty-level physicians. 1, 2, 4-8, 13-15 Implementation of Accreditation Council for Graduate Medical Education (ACGME) work-hour restrictions has been linked to fewer car accidents, fewer percutaneous injuries, and fewer medical errors among residents. 11, 12 However, an objective study of resident sleep via ActiGraph showed no association with these changes on resident burnout or well-being. 10 Faculty physicians in various specialties have reported more burnout, less job satisfaction, higher rates of medical errors, and higher rates of motor vehicle crashes/near-crashes when sleep deprived. 1, 2, 4, 5, 7, 13 A review found that eight of 14 studies reported a positive effect of interventions limiting work hours (primarily among residents), modifying work schedules, or promoting time banking; 8 the review inferred that limiting consecutive nights of work and protecting several hours of sleep each call night were associated with decreased fatigue and emotional exhaustion. 8 Work-hour restrictions in one study actually increased resident stress due to pressure to get the same amount of work done in less time. 16 The same review mentioned earlier showed that faculty job satisfaction improved from an institutional time-banking system that recognized effort spent on teaching, administrative work, and mentorship. 8 An important randomized study comparing continuous versus interrupted coverage schedules for CCUs found that faculty who worked interrupted schedules had lower rates of burnout and job distress, with noninferior patient outcomes. 13 Additionally, practice patterns and patient outcomes have been found to vary depending on obstetrician call schedules. 14, 15 These studies demonstrate that physician work hours and call structures affect job satisfaction, fatigue, physician behavior, and patient outcomes.
A clear gap exists in the published literature. How the characteristics of inpatient coverage by family medicine residency program faculty affect faculty retention and satisfaction with work-life integration is unclear. The purpose of this study is to begin filling that gap and to identify protective factors for faculty staffing of family medicine residency program inpatient services.
This survey was administered by the Council of Academic Family Medicine (CAFM) Educational Research Alliance (CERA). 17 CAFM is a leadership and research collaborative among the Association of Departments of Family Medicine, the Association of Family Medicine Residency Directors (AFMRD), the North American Primary Care Research Group, and the Society of Teachers of Family Medicine. As previously described, program directors (PDs) receive the CERA survey once or twice annually. 18 The study was approved by the American Academy of Family Physicians Institutional Review Board. Data were collected from April 18 to May 12, 2023.
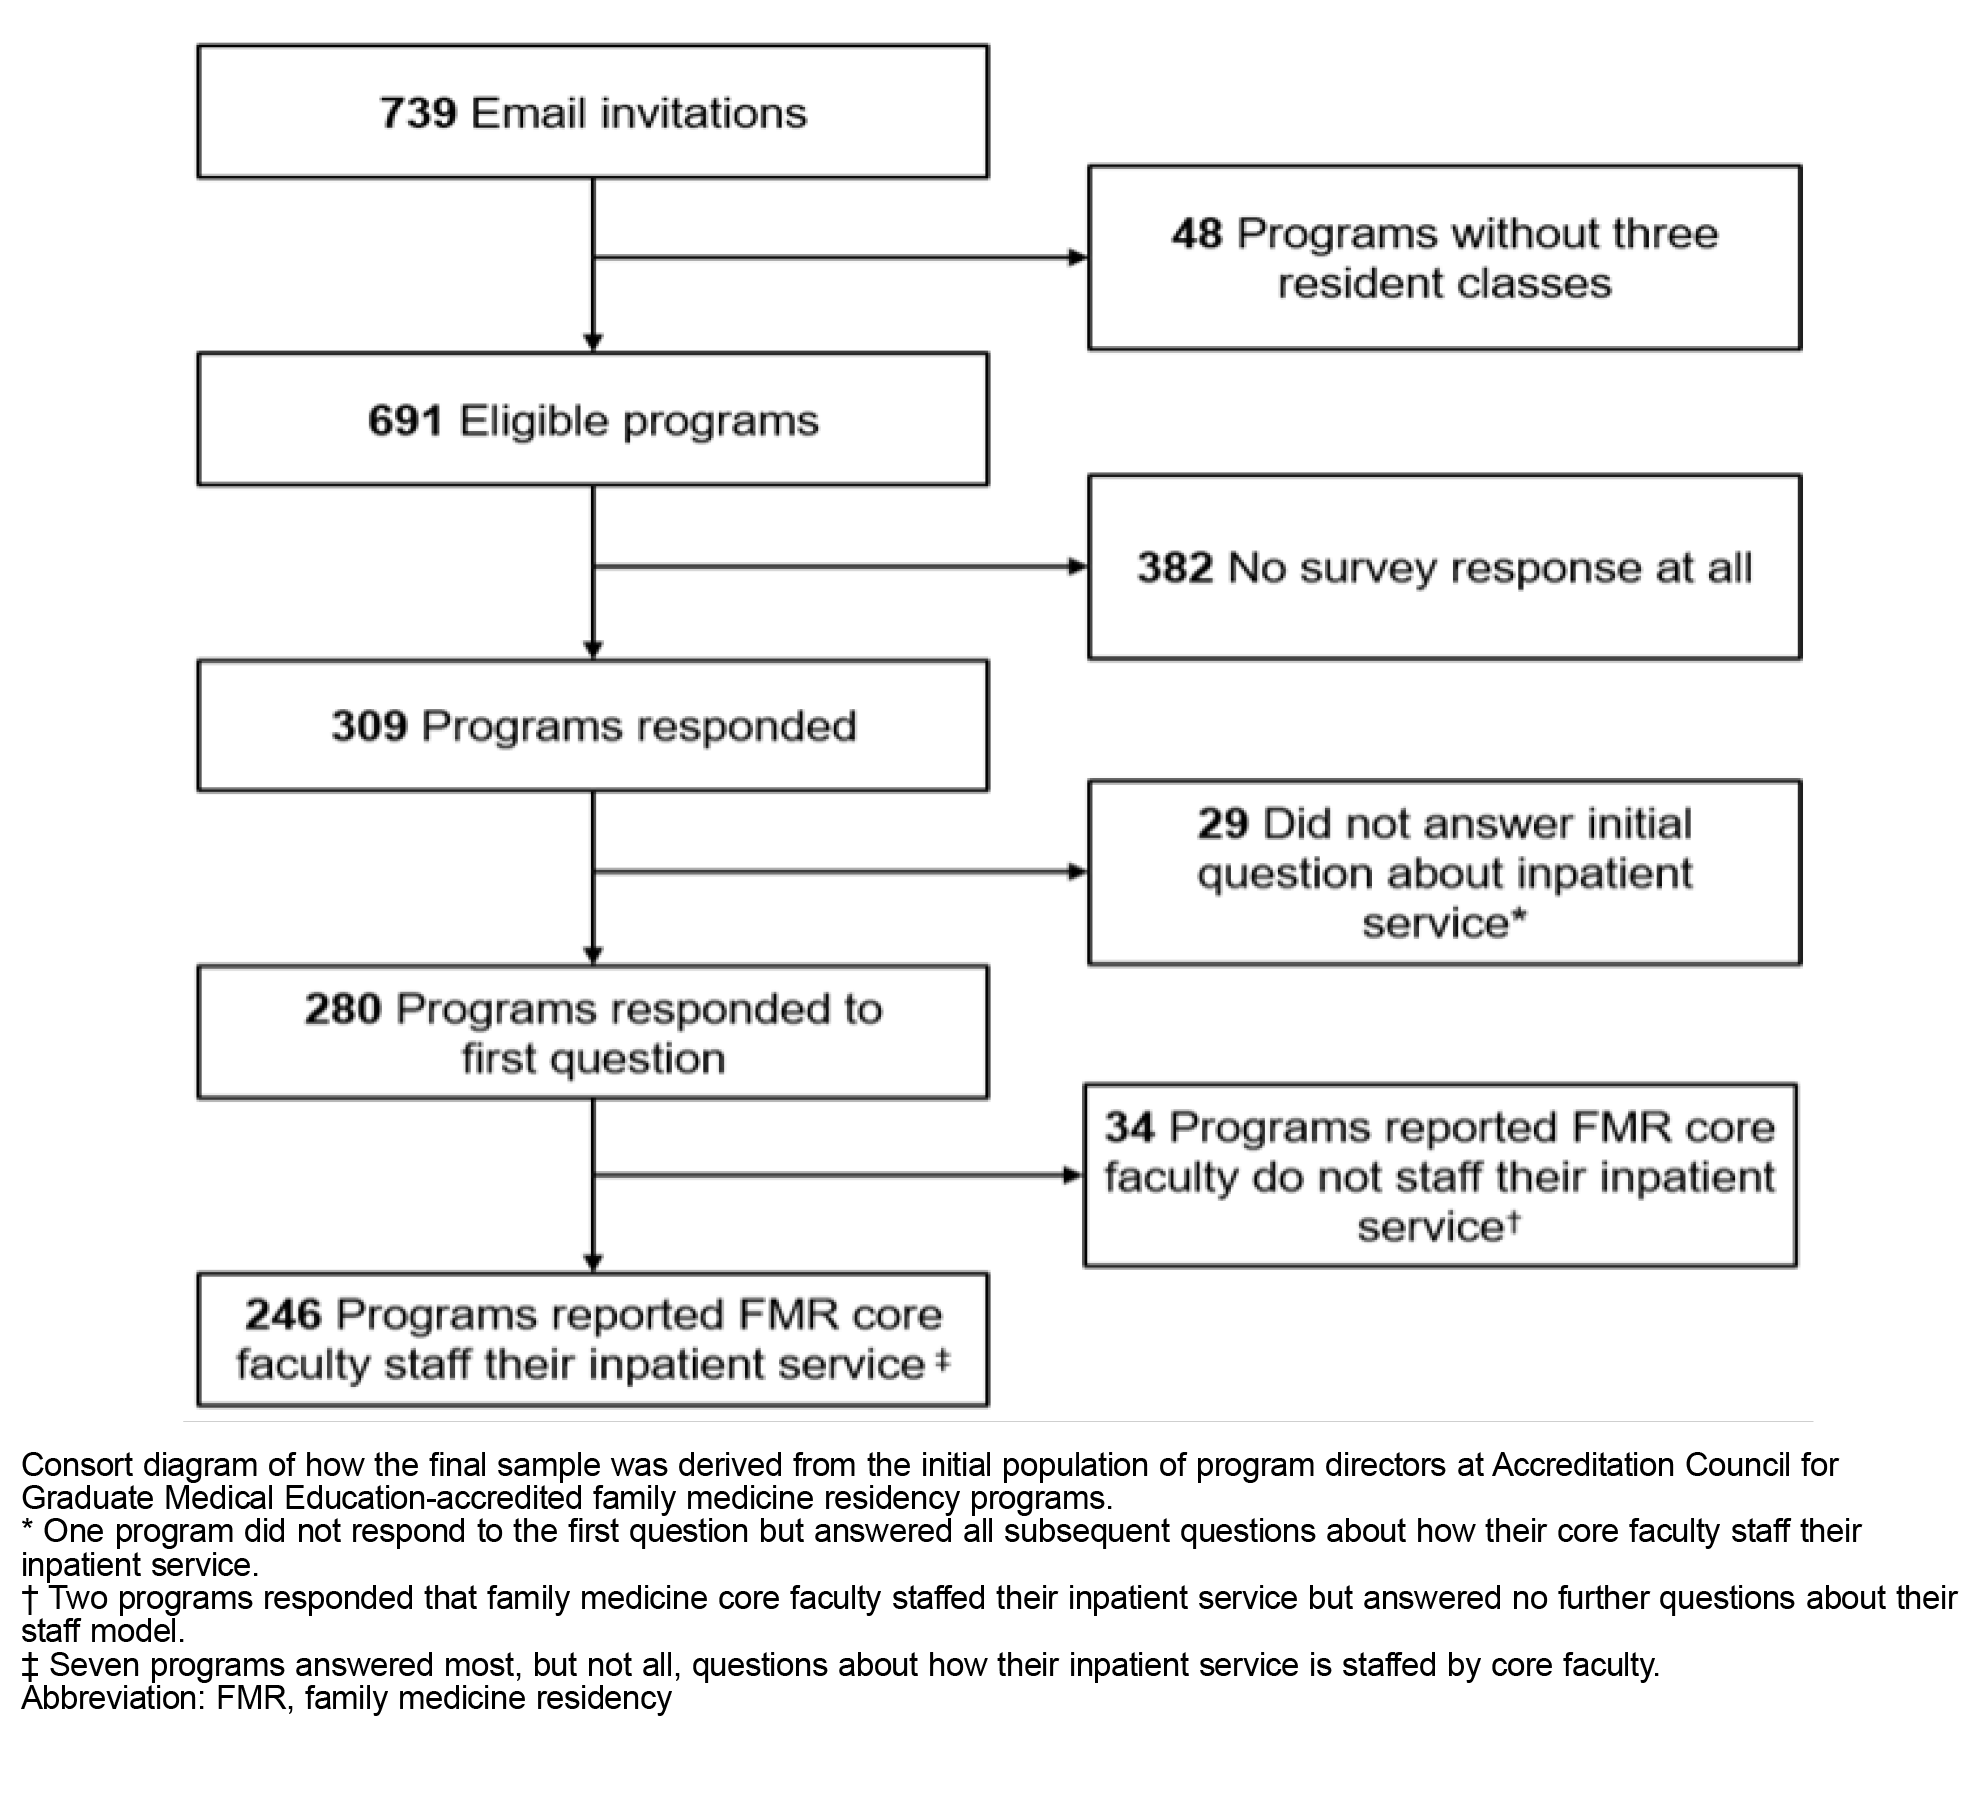
The target population was all ACGME-accredited US family medicine PDs as identified by AFMRD. email invitation and a link to collectedanonymous responses. Three follow-up emails to nonresponding participants were sent weekly after the initial email invitation, and a fourth reminder was sent 1Six email addresses were undeliverable, leaving 739 invithree resident classes. Forty-eight PDs indicated that they did not meet criteria; reducing the sample size to 691 (Figure 1).
Of the 309 respondents, 29 (9%) did not answer the initial question about whether family medicine core faculty staff their inpatient service; one of these PD respondents went on to answer all remaining questions, so this response was imputed as “yes.” Two respondents reported inpatient staffing by family medicine core faculty but answered no questions about their staffing model; these were coded as missing and not included in the final sample. The seven other respondents that did not answer all questions were included in the final sample. We used a ꭓ2 test to check for differences between the total sample and the final sample.
Recurring demographic data about the programs and PD respondents were collected. 19 Ten single-answer, multiple-choice questions were developed iteratively by the authors until achieving consensus (Table 1). The two dependent variables were (a) percentage turnover of inpatient-practicing family medicine faculty, and (b) perceived overall faculty satisfaction with work-life integration. The independent variables were (a) number of weeks per year, (b) number of hours worked per week, (c) staffing model of daytime coverage, (d) staffing model of nighttime coverage, (e) number of times contacted per night, (f) percentage of time simultaneously covering additional clinical services, and (g) plans for change.
|
Questions
|
Choice of responses
|
n (%)
|
|
(a) On average, for those family medicine core faculty members that practice inpatient medicine, how many weeks per year does each cover the inpatient service?
|
<4 wks (every 14+ wks)
|
4 (1.6)*
|
|
4–6 wks (every 9–13 wks)
|
78 (32.1)
|
|
7–9 wks (every 6–8 wks)
|
90 (37.0)
|
|
10–13 wks (every 4–5 wks)
|
46 (18.9)
|
|
>13 (every 2–3 wks)
|
25 (10.3)
|
|
(b) On average, what is your best estimate of the number of hours family medicine core faculty work in a week while covering the inpatient service (excluding being available on call at home and not tangibly working, but including other responsibilities (eg, supervising, in-basket, email)?
|
<60 hrs
|
55 (22.7)**
|
|
60–69 hrs
|
90 (37.2)
|
|
70–79 hrs
|
54 (22.3)
|
|
80–89 hrs
|
34 (14.0)
|
|
>89 hrs
|
9 (3.7)
|
|
(c) Which of the following best describes how your family medicine core faculty cover the inpatient service during the day?
|
7 days on, 7 off
|
29 (11.9)*
|
|
7 days on, 4–6 off
|
6 (2.5)
|
|
7 days on, 2–3 off
|
64 (26.3)
|
|
<7 days consecutive days on
|
31 (12.8)
|
|
Other
|
113 (46.5)
|
|
(d) Which of the following best describes how your family medicine core faculty cover your program’s inpatient service overnight?
|
Same faculty day and night (24 hr)
|
80 (32.9)*
|
|
Different faculty for 1 night (rotating night shift)
|
82 (33.7)
|
|
Different faculty covers string of nights
|
14 (5.8)
|
|
Different service covers overnight (internal medicine, hospitalist)
|
45 (18.5)
|
|
Other
|
22 (9.1)
|
|
(e) Using your best estimate, how frequently is the overnight family medicine core faculty covering the inpatient service contacted by a resident and/or the hospital (nurses, emergency department, etc) about hospitalized patients (not outpatient or obstetrics) at night?
|
Not applicable
|
40 (16.5)*
|
|
Once every 2 wks or less (very rarely)
|
12 (4.9)
|
|
1–3x weekly (less than once per night)
|
31 (12.8)
|
|
4–10x weekly (about once per night)
|
52 (21.4)
|
|
2–3x nightly (couple of times per night)
|
75 (30.9)
|
|
>3x per night
|
27 (11.1)
|
|
I don’t know
|
6 (2.5)
|
|
(f) What percentage of the time is the overnight family medicine core faculty member covering the inpatient service also responsible for additional clinical duties at night (eg, obstetrics care, outpatient phone calls, outpatient critical lab results, and nonresidency-related on-call coverage)?
|
Not applicable
|
50 (20.5)
|
|
0%
|
80 (32.8)
|
|
1–25%
|
40 (16.4)
|
|
26–50%
|
15 (6.1)
|
|
51–75%
|
7 (2.9)
|
|
76–100%
|
48 (19.7)
|
|
I don’t know
|
4 (1.6)
|
|
Questions
|
Choice of responses
|
n (%)
|
|
(g) Regardless of why, what percentage of your family medicine core faculty who provide inpatient service supervision have left their position or stopped providing inpatient coverage in the past 5 years?
|
<10%
|
144 (59.3)*
|
|
10–25%
|
66 (27.2)
|
|
25–50%
|
21 (8.6)
|
|
51–75%
|
8 (3.3)
|
|
>75%
|
4 (1.6)
|
|
(h) For your family medicine core faculty who participate in inpatient service supervision, what is your overall perception of their current level of satisfaction with work-life integration?
|
Very dissatisfied
|
4 (1.6)*
|
|
Dissatisfied
|
31 (12.8)
|
|
Neutral
|
50 (20.6)
|
|
Satisfied
|
120 (49.4)
|
|
Very satisfied
|
36 (14.8)
|
|
I don’t know
|
2 (0.8)
|
|
(i) As the program director, what most accurately describes what you foresee happening with your program’s inpatient staffing model for family medicine core faculty over the next 2 years?
|
Minor changes to decrease workload
|
59 (24.3)*
|
|
Minor changes to increase compensation time after coverage
|
32 (13.2)
|
|
Major changes
|
33 (13.6)
|
|
No change
|
109 (44.9)
|
|
Changes to increase clinical productivity
|
10 (4.1)
|
The types of daytime and nighttime staffing models are categorical variables. All other variables are ordinal; however, a few ordinal variables contained one or two nonordinal categorical options (ie, not applicable [N/A], other, and/or I don’t know). All original responses are presented in Table 2. When performing analyses, the following conversions for ordinal variables were used: (a) For the questions about contact frequency overnight and work-life integration, “I don’t know” was converted into the mode response; and (b) for the questions about contact frequency overnight and covering other clinical duties at night, N/A was converted into “once every 2 weeks or less” and “0%,” respectively, because we assumed that having a different service cover the program’s inpatient service to be the most likely reason for the question not being applicable. For the question about plans to change the inpatient staffing model, the responses “minor changes to decrease workload” and “minor changes to increase compensation time after coverage” were given equivalent rank as an ordinal variable.
|
Variables
|
Family medicine core faculty staff inpatient service.
(N=246)
|
Inpatient service is not staffed by family medicine core faculty.
(N=34)
|
|
|
|
n (%)*
|
n (%)*
|
P value
|
|
Program type
|
.01
|
|
University-based
|
47 (19)
|
0
|
|
|
Community-based, university-affiliated
|
137 (56)
|
25 (74)
|
|
|
Community-based, nonaffiliated
|
54 (22)
|
8 (24)
|
|
|
Military
|
1 (0)
|
0
|
|
|
Other
|
6 (2)
|
1 (3)
|
|
|
Program location
|
.24
|
|
New England
|
8 (3)
|
0
|
|
|
Middle Atlantic
|
34 (14)
|
6 (18)
|
|
|
South Atlantic
|
39 (16)
|
5 (15)
|
|
|
East South Central
|
12 (5)
|
1 (3)
|
|
|
East North Central
|
37 (15)
|
6 (18)
|
|
|
West South Central
|
31 (13)
|
4 (12)
|
|
|
West North Central
|
27 (11)
|
2 (6)
|
|
|
Mountain
|
23 (9)
|
4 (12)
|
|
|
Pacific
|
35 (14)
|
6 (18)
|
|
|
Community size
|
.03
|
|
<30k
|
30 (12)
|
2 (6)
|
|
|
30k to 75k
|
33 (13)
|
5 (15)
|
|
|
75k to 150k
|
48 (20)
|
7 (21)
|
|
|
150k to 500k
|
65 (27)
|
6 (18)
|
|
|
500k to 1 million
|
26 (11)
|
9 (26)
|
|
|
>1 million
|
44 (18)
|
5 (15)
|
|
|
Program size
|
.03
|
|
<20 residents
|
92 (38)
|
19 (56)
|
|
|
20–31 residents
|
116 (47)
|
10 (29)
|
|
|
>31 residents
|
37 (15)
|
5 (15)
|
|
First, we used Pearson’s ꭓ2 test to assess whether two variables were associated with each other; this was performed between all pairs of independent and dependent variables, which are fundamentally categorical. If the ꭓ2 test found a significant association, we measured the linear association between two ordinal variables via Spearman’s rank correlation coefficient, which handles ties better than Kendall’s. 20 We had initially planned to assess for two-way interactions between independent variables on the two dependent variables with ordinal logistic regression; however, this was not appropriate due to overfitting from small cell sizes. P values <.05 were considered significant without adjustment for multiple comparisons. All statistically significant associations presented remained significant in sensitivity analyses that censored “I don’t know” responses. Analyses were performed with JMP version 17.2.0 (SAS Institute Inc).
The overall response rate for the survey was 45% (309/691). After excluding the 29 PD respondents that did not answer the initial question, we found that 88% (246/280) of responding programs had family medicine core faculty supervising inpatient care. The nonresponders were not significantly different from the responders (P>.05 for all comparisons). Most respondents represented community-based, university-affiliated programs from all regions of the country, serving communities of all sizes, including smaller sizes (only 15% had more than 31 residents). Table 2 compares the characteristics of the programs that staff their inpatient service with family medicine core faculty with those that have other physicians staff their inpatient service. Programs that (a) are not university-based, (b) serve a 500,000 to 1 million-sized community, and (c) have fewer than 20 residents, were less likely to staff their inpatient service with family medicine core faculty.
The overall distribution of responses is listed in Table 1. The mode responses indicated that most commonly, family medicine residency core faculty covered the inpatient service for (a) 7 to 9 weeks per year (every 6–8 wks) for (b) 60 to 69 hours per week, (c) with varying schedules for covering inpatient service during the day. PD respondents most frequently reported that they (d) had a different faculty cover overnight, (e) who was contacted two to three times per night, (f) and covered only the inpatient service at night. The PD respondents most frequently reported (g) low faculty turnover, (h) overall satisfaction of faculty with work-life integration, and (i) no plans to change the current staffing model.
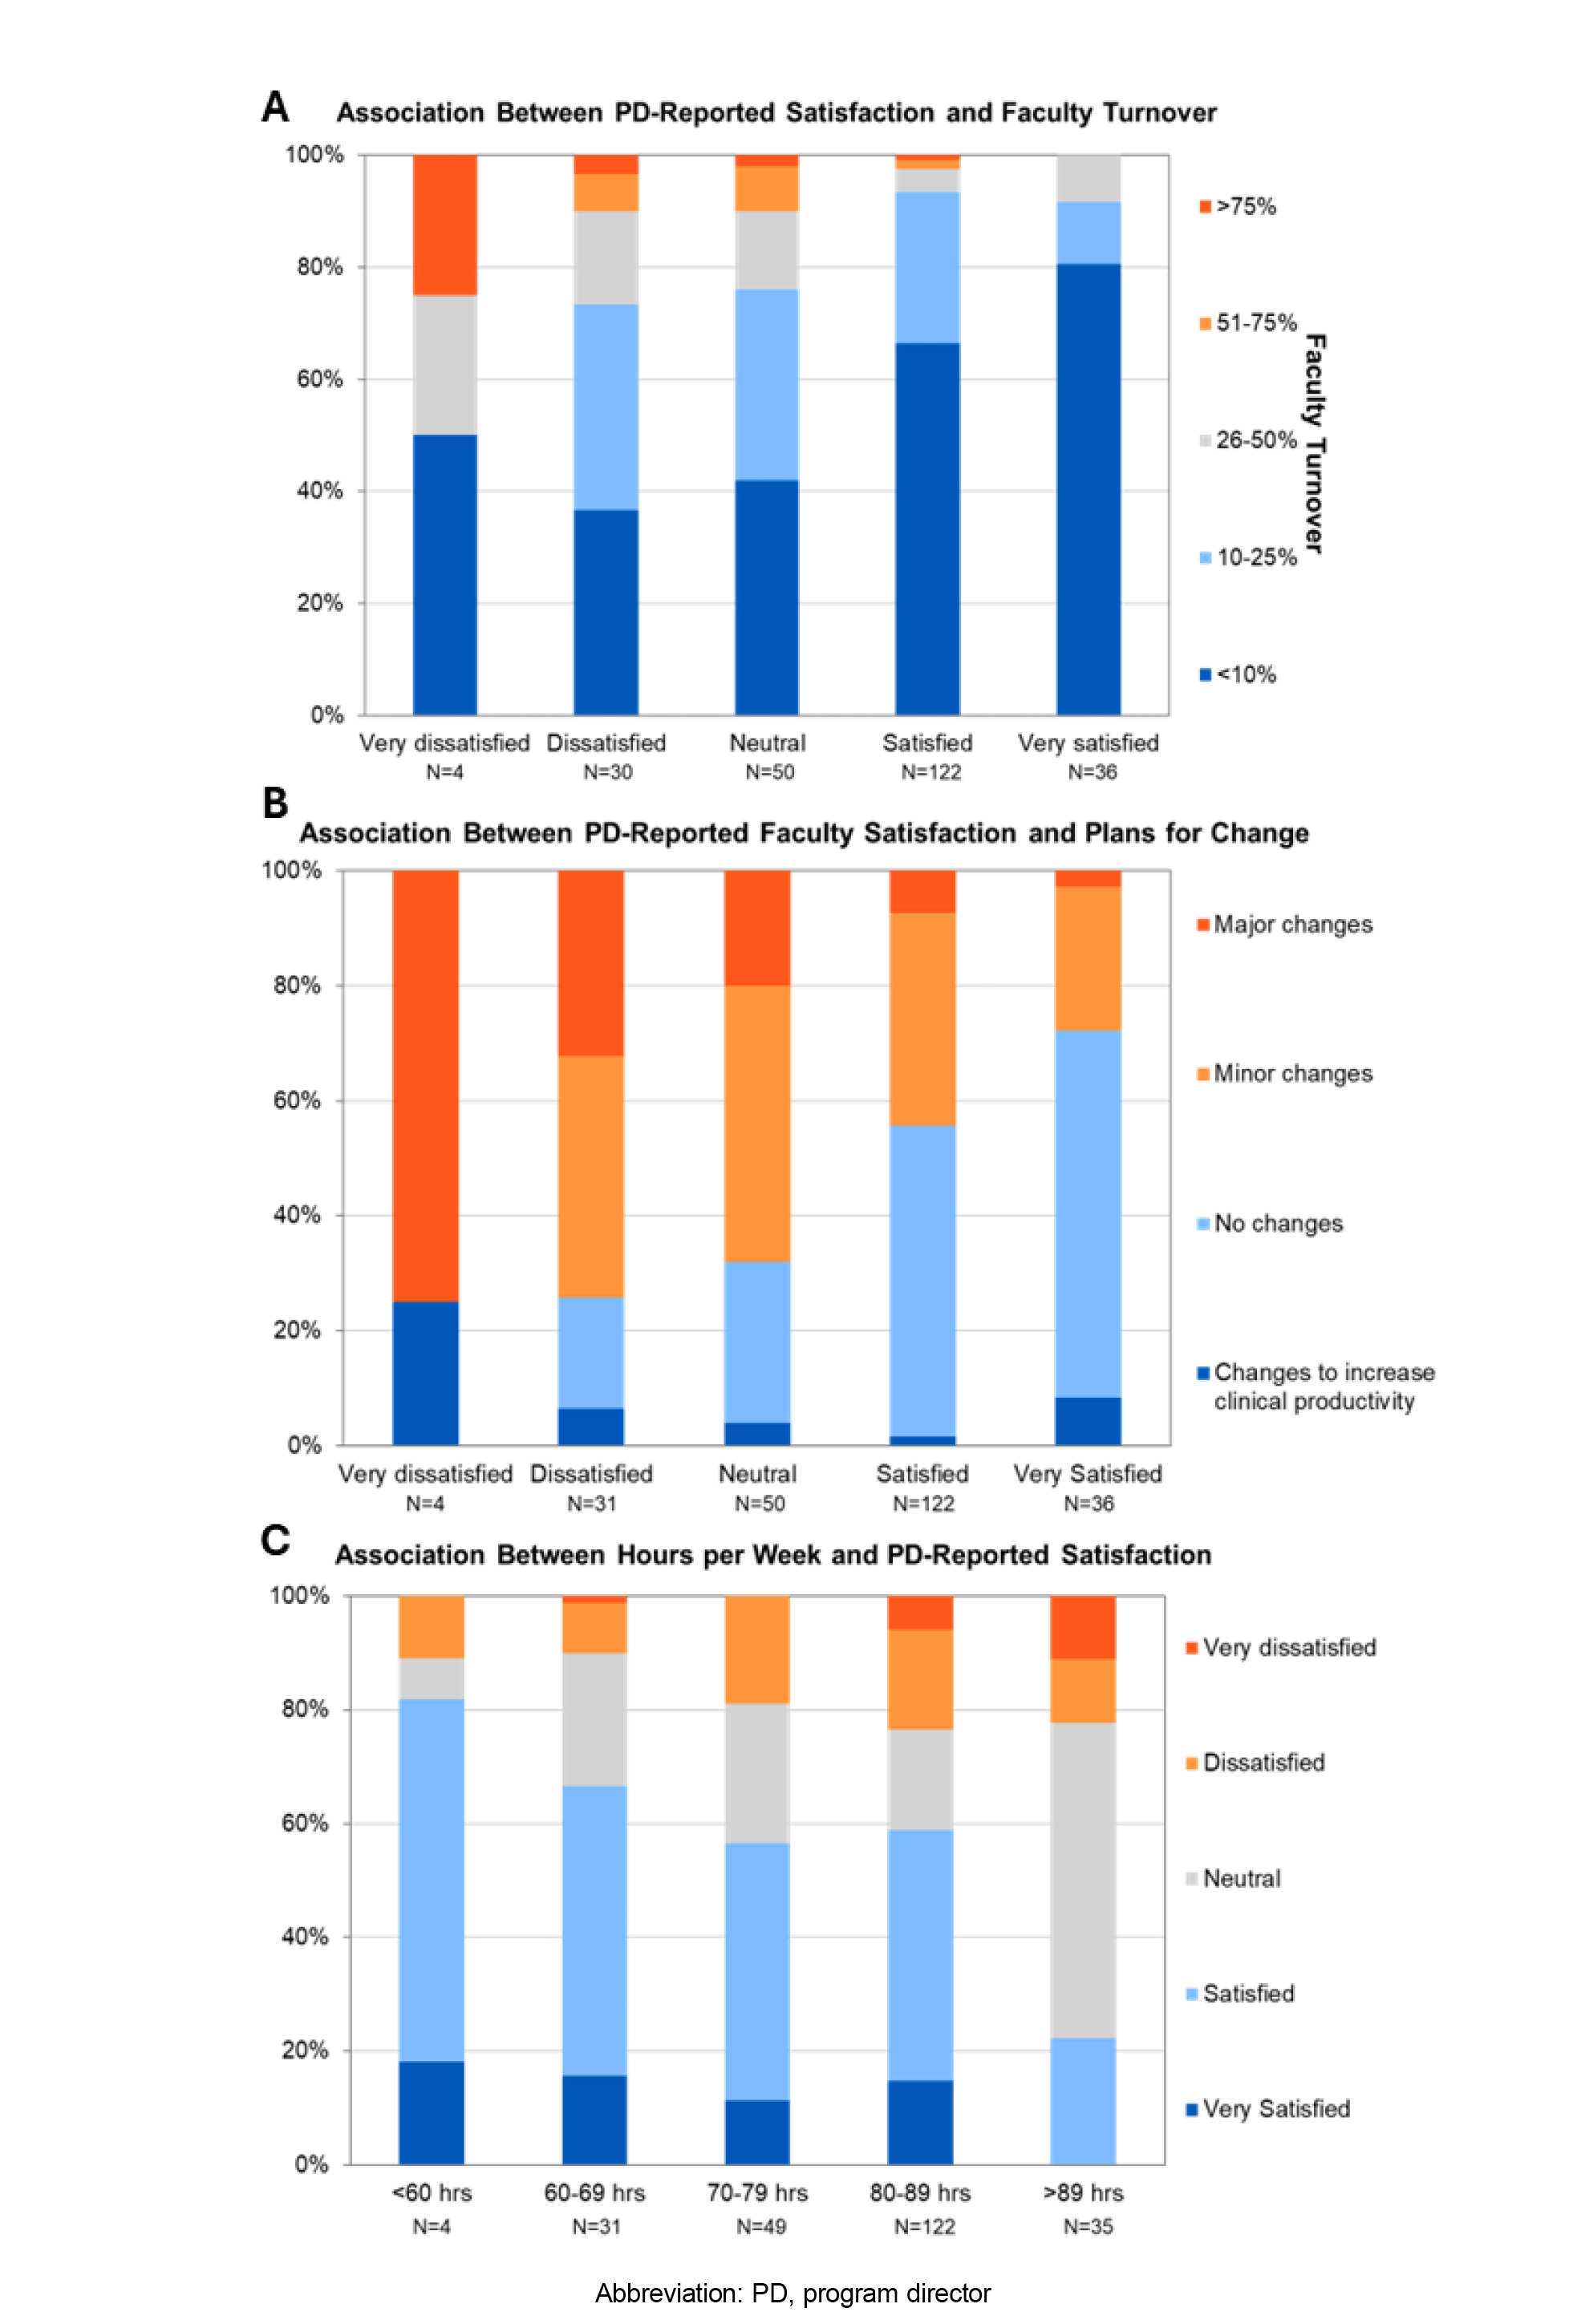
PD respondent assessment of faculty satisfaction with work-life integration was associated with faculty retention (r=0.32, P<.0001), fewer plans for changing the program’s inpatient staffing model (r=-0.33, P<.0001), and the average number of hours worked per week (r=-0.21, P=.001; Figure 2 A–C). PD-reported faculty satisfaction was nonlinearly associated with weeks per year (Supplemental Figure 1). Otherwise, no other measure was significantly associated with PD-reported satisfaction with work-life integration (P>.05).
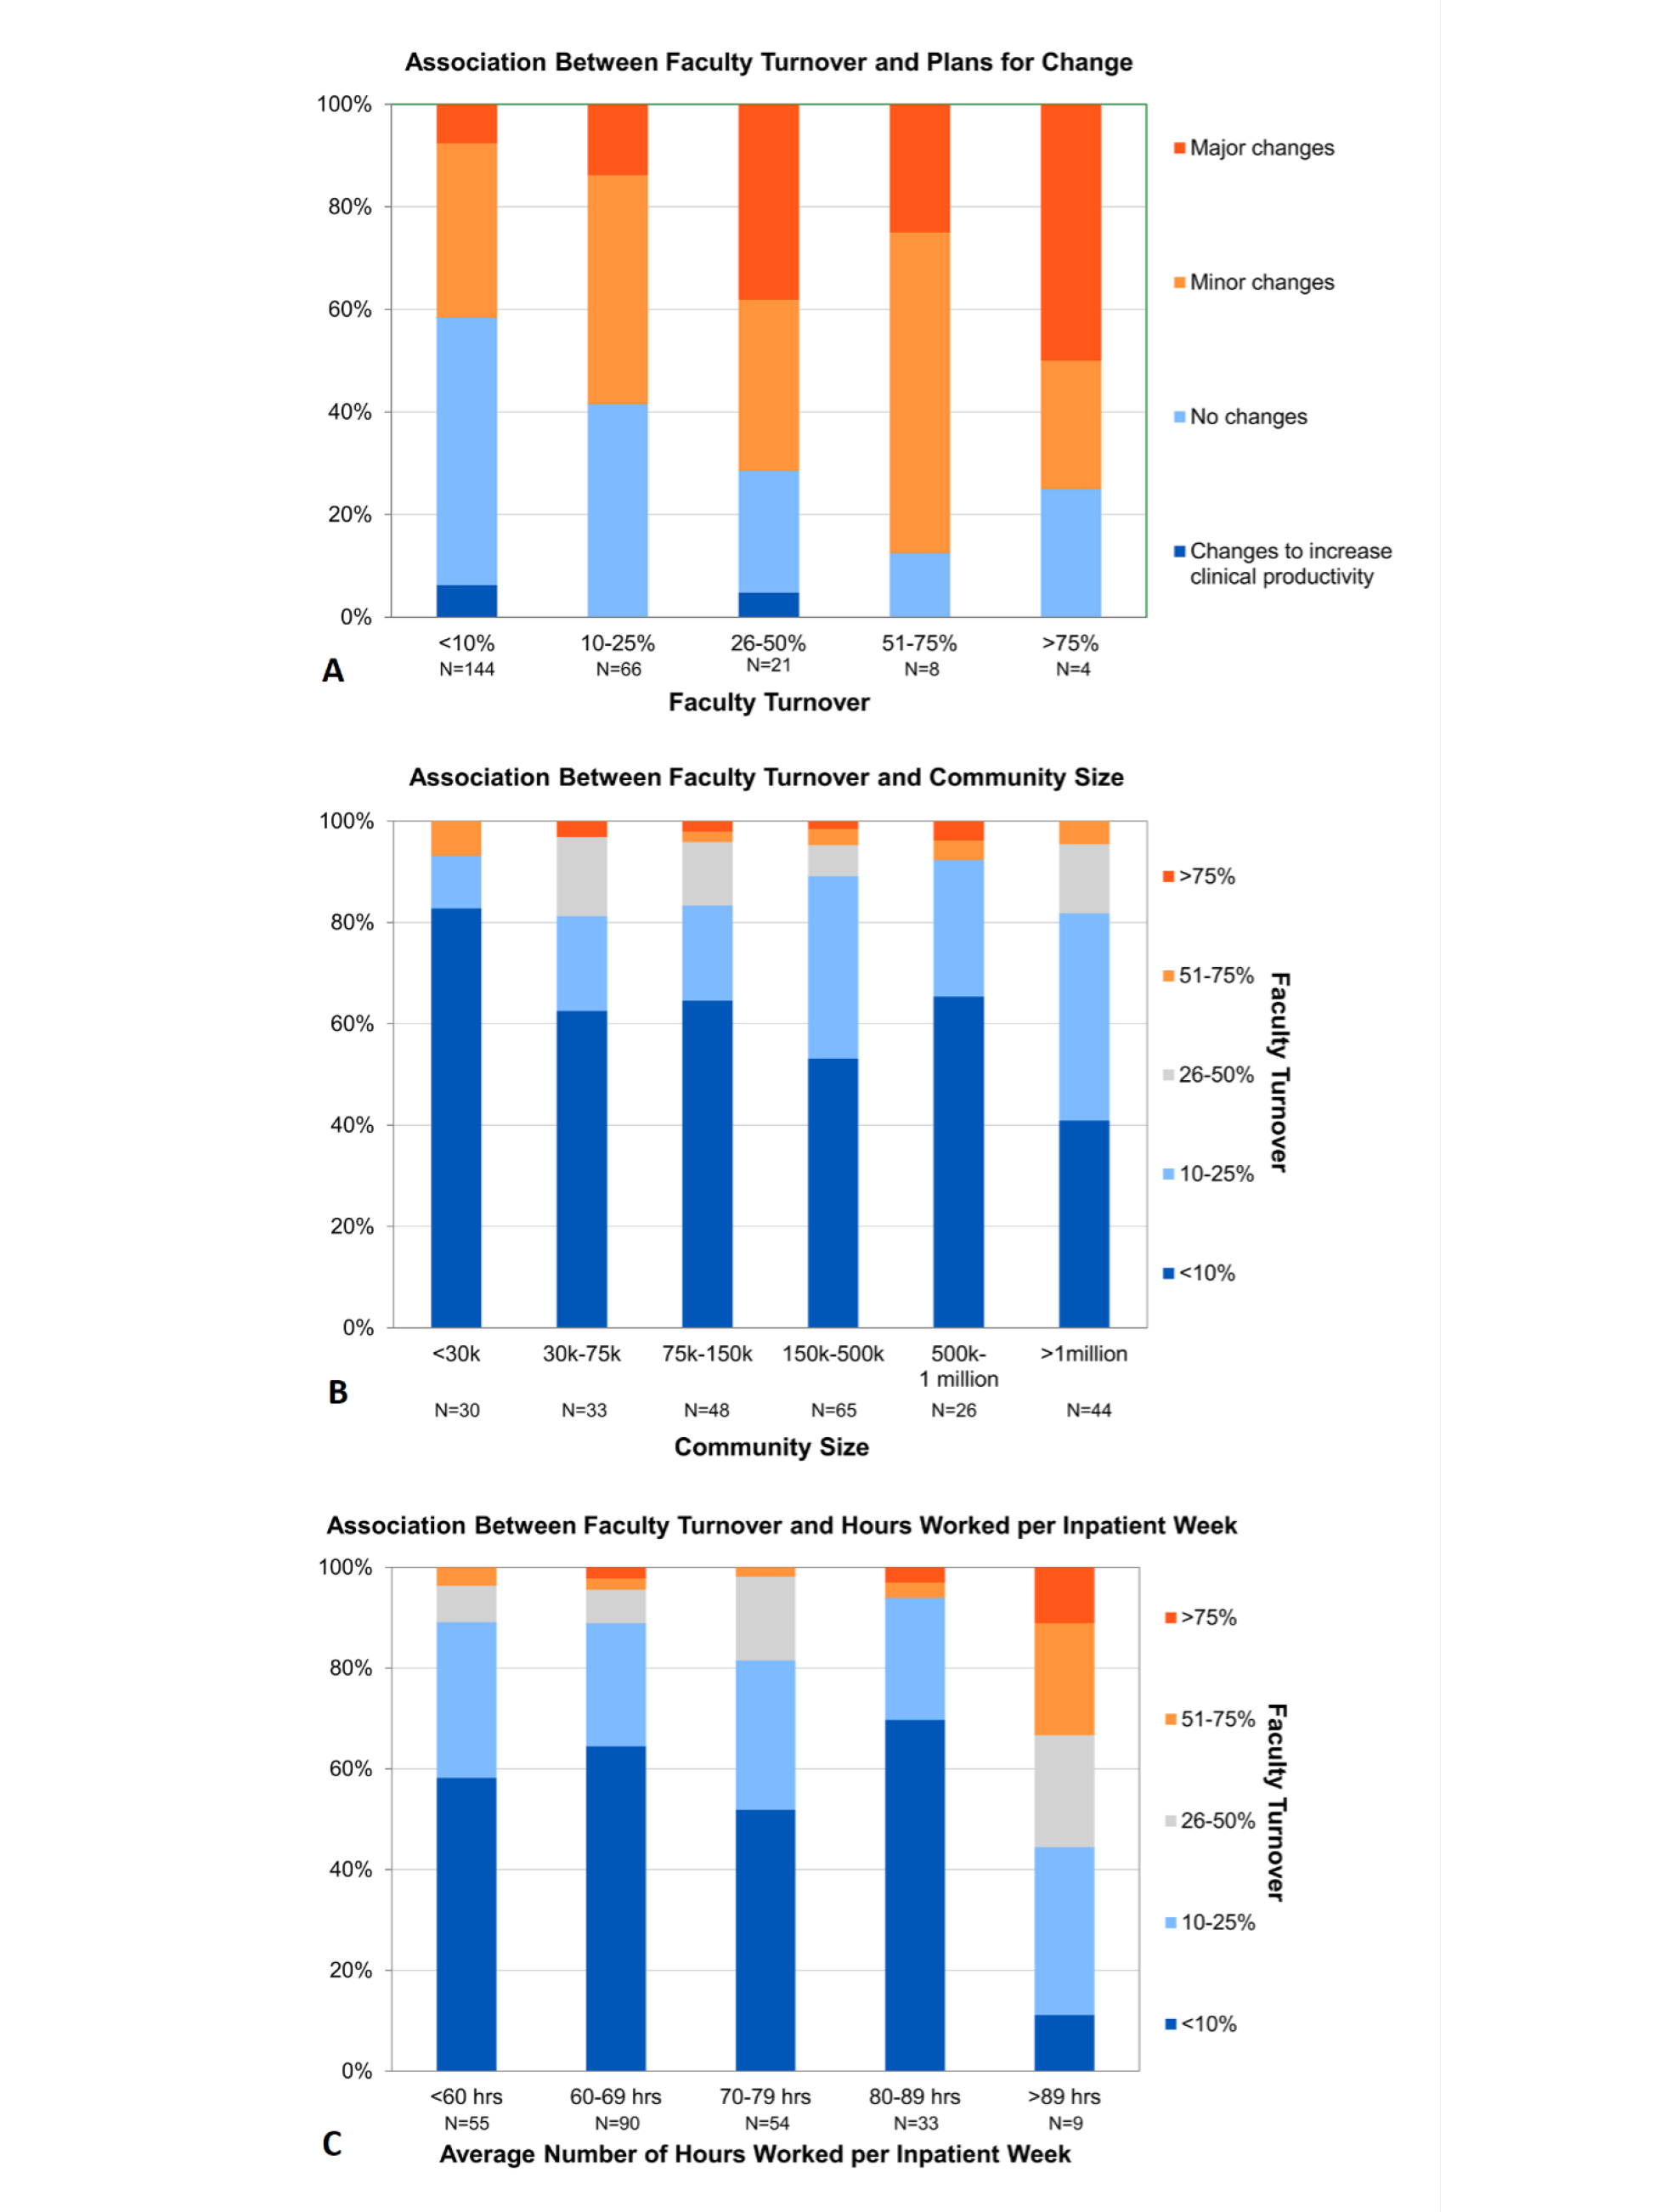
Faculty turnover was positively associated with plans to change the inpatient staffing model (r=0.29, P<.0001) and the size of the community served (r=0.17, P=.007; Figure 3 3A and 3B). Faculty turnover was associated with hours per week (P=.02), but not linearly (r=0.07, P=.26; Figure 3C). We identified a threshold effect, wherein, compared to working less, working 90 or more hours per week was associated with increased likelihood of greater than 10% faculty turnover (odds ratio: 12.4; 95% confidence interval: 1.5 to 100). No other associations with faculty turnover were statistically significant.
Our study is the first to report the extent of inpatient service coverage by family medicine residency faculty and how this relates to faculty turnover and perceived satisfaction with work-life integration. Most (>2/3) family medicine residency programs have core faculty covering the inpatient service at least once every 8 weeks, or about 6 weeks per year. Given that a typical full-time hospitalist works about every other week, or 23 to 26 weeks per year, most programs have family medicine core faculty essentially doing the equivalent work of a 0.25 hospitalist. We highlight this finding because, given everything else asked of family medicine core faculty, covering the inpatient service likely does not represent just 25% of their responsibilities. During inpatient weeks, most (>3/4) programs have faculty that are working more than 60 hours, which is higher than the overall average for US physicians. 21 Frequent overnight contact, combined with a sizeable minority of programs having the same faculty covering both day and night, suggests that many faculty are at high risk of sleep deprivation. Nevertheless, most program directors reported that their faculty are satisfied with work-life integration overall, and faculty turnover is low (<10% over the past 5 years). We found no evidence of an overall ideal staffing model associated with high PD-reported faculty satisfaction and retention.
We found that PD-reported faculty satisfaction decreased as the number of hours worked increased; similarly, programs with 90 or more hours per inpatient week had lower faculty retention. Higher faculty turnover correlated with greater plans to change, indicating that program directors see that the inpatient staffing model influences retention (and recruitment) of faculty. We observed lower rates of faculty turnover in programs serving smaller communities, which may be related to a stronger commitment to rural places and/or greater local job opportunities in urban settings if faculty wish to change jobs but not move. Though recruiting family physicians to be faculty in programs serving smaller communities may be more challenging, our data suggest that once there, physicians are less likely to leave compared to programs in larger communities. The survey had strong evidence of internal validity: faculty turnover, low PD-reported satisfaction, and plans to change inpatient staffing were all correlated in the expected direction.
This study has several limitations. First, the data were limited to PD perception of faculty work-life satisfaction and turnover without objective measures of faculty turnover, work, or sleep, nor direct measurement of faculty satisfaction or burnout. The results are likely biased by social desirability and cognitive dissonance. Second, program directors were asked to consider faculty as a homogenous group, but faculty staffing of their inpatient service may be quite varied within a program; and individual core faculty members’ attitudes regarding work-life balance may be diverse or not known to the program director. Nonetheless, PD perception strongly impacts staffing decisions and thus has meaning per se. Sampling bias is another limitation, despite the fact that our response rate is comparable to other national surveys. 22 Third, nearly half of respondents selected “other” for their day staffing model, which indicates that our listed responses did not capture the diversity in how family medicine programs staff their inpatient service. The drivers of faculty turnover and satisfaction with work-life integration may be completely unrelated to the inpatient staffing model and actually may reflect other problems in the organization. The weak Spearman’s correlations presented, ranging from 0.17 to 0.34, indicate that much of the variation in retention and satisfaction among programs remains unexplained. Lastly, the cross-sectional study describes associations that can generate only hypotheses about causation.
Future research of faculty staffing models could be strengthened with more objective measurements of faculty well-being (eg, a validated burnout questionnaire or employment data), as well as learner and patient outcomes. While reports are available on how sleep deprivation affects other health care professionals, its effects on family medicine faculty are only anecdotal and deserve elucidation. Overworked and sleep-deprived faculty likely do not role model and teach their best. Creating ideal learning environments free of microaggressions and mistreatment is an active issue in the United States;23, 24sleep and other factors that affect noninclusive training and working environments need further study and solutions.
In conclusion, core family medicine program faculty play a pivotal role in training the next generation of primary care physicians for a broad scope of practice; these academic family physicians fill a large variety of roles in their department and institutions. To best help our learners and achieve the quadruple aim in health care, we need an accurate assessment of the amount and type of work family medicine faculty perform. We hope these results spur further research and advocacy efforts to elucidate optimal staffing models that meet the needs of the program, learners, communities, and faculty themselves.
References
-
Shanafelt TD, West CP, Sinsky C, et al. Changes in burnout and satisfaction with work-life integration in physicians and the general US working population between 2011 and 2017. Mayo Clin Proc. 2019;94(9):1,681-1,694.
-
Abdalla RN, Ansari SA, Hurley MC, et al. Correlation of call burden and sleep deprivation with physician burnout, driving crashes, and medical errors among US neurointerventionalists.
AJNR Am J Neuroradiol. 2022;43(9):1,286-1,291.
doi:10.3174/ajnr.A7606
-
Bourne DW, Epstein E. The experience of moral distress in an academic family medicine clinic
. HEC Forum. 2023;35:37-54.
doi:10.1007/s10730-021-09453-9
-
Del Carmen MG, Herman J, Rao S, et al. Trends and factors associated with physician burnout at a multispecialty academic faculty practice organization.
JAMA Netw Open. 2019;2(3):e190554.
doi:10.1001/jamanetworkopen.2019.0554
-
Heponiemi T, Kouvonen A, Vänskä J, et al. Effects of active on-call hours on physicians’ turnover intentions and well-being.
Scand J Work Environ Health. 2008;34(5):356-363.
doi:10.5271/sjweh.1278
-
Kancherla BS, Upender R, Collen JF, et al. Sleep, fatigue and burnout among physicians: an American Academy of Sleep Medicine position statement.
J Clin Sleep Med. 2020;16(5):803-805.
doi:10.5664/jcsm.8408
-
Lin R-T, Lin Y-T, Hsia Y-F, Kuo C-C. Long working hours and burnout in health care workers: non-linear dose-response relationship and the effect mediated by sleeping hours—a cross-sectional study.
J Occup Health. 2021;63(1):e12228.
doi:10.1002/1348-9585.12228
-
DeChant PF, Acs A, Rhee KB, et al. Effect of organization-directed workplace interventions on physician burnout: a systematic review.
Mayo Clin Proc Innov Qual Outcomes. 2019;3(4):384-408.
doi:10.1016/j.mayocpiqo.2019.07.006
-
Hinojosa-Gonzalez DE, Farias JS, Tellez-Giron VC, Aguirre-Villarreal D, Brenes-Castro D, Flores-Villalba E. Lower frequency of call shifts leads to higher attendance, higher academic performance, and less burnout syndrome in surgical clerkships. Journal of Surgical Education. 2021;78(2):485-491.
-
Mendelsohn D, Despot I, Gooderham PA, Singhal A, Redekop GJ, Toyota BD. Impact of work hours and sleep on well-being and burnout for physicians-in-training: the resident activity tracker evaluation study.
Med Educ. 2019;53(3):306-315.
doi:10.1111/medu.13757
-
Weaver MD, Landrigan CP, Sullivan JP, et al. National improvements in resident physician-reported patient safety after limiting first-year resident physicians’ extended duration work shifts: a pooled analysis of prospective cohort studies.
BMJ Qual Saf. 2023;32(2):81-89.
doi:10.1136/bmjqs-2021-014375
-
Weaver MD, Landrigan CP, Sullivan JP, et al. The association between resident physician work-hour regulations and physician safety and health.
Am J Med. 2020;133(7):e343-e354.
doi:10.1016/j.amjmed.2019.12.053
-
Ali NA, Hammersley J, Hoffmann SP, et al; Midwest Critical Care Consortium. Continuity of care in intensive care units: a cluster-randomized trial of intensivist staffing.
Am J Respir Crit Care Med. 2011;184(7):803-808.
doi:10.1164/rccm.201103-0555OC
-
Barber EL, Eisenberg DL, Grobman WA. Type of attending obstetrician call schedule and changes in labor management and outcome.
Obstet Gynecol. 2011;118(6):1,371-1,376.
doi:10.1097/AOG.0b013e31823904d0
-
Yee LM, Liu LY, Grobman WA. Obstetrician call schedule and obstetric outcomes among women eligible for a trial of labor after cesarean.
Am J Obstet Gynecol. 2017;216(1):75.e1-75.e6.
doi:10.1016/j.ajog.2016.08.032
-
Morrow G, Burford B, Carter M, Illing J. Have restricted working hours reduced junior doctors’ experience of fatigue? a focus group and telephone interview study.
BMJ Open. 2014;4(3):e004222.
doi:10.1136/bmjopen-2013-004222
-
-
Seehusen DA, Mainous AG III, Chessman AW. Creating a centralized infrastructure to facilitate medical education research.
Ann Fam Med. 2018;16(3):257-260.
doi:10.1370/afm.2228
-
-
Puth M-T, Neuhäuser M, Ruxton GD. Effective use of Spearman’s and Kendall’s correlation coefficients for association between two measured traits.
Anim Behav. 2015;102:77-84.
doi:10.1016/j.anbehav.2015.01.010
-
Shanafelt TD, West CP, Sinsky CA, et al. At-risk work hours among U.S. physicians and other U.S. workers.
Am J Prev Med. 2023;65(4):568-578.
doi:10.1016/j.amepre.2023.03.020
-
Wu M-J, Zhao K, Fils-Aime F. Response rates of online surveys in published research: a meta-analysis.
Computers in Human Behavior Reports. 2022;7:100206.
doi:10.1016/j.chbr.2022.100206 Computers in Human Behavior Reports 7:100206.
-
Espaillat A, Panna DK, Goede DL, Gurka MJ, Novak MA, Zaidi Z. An exploratory study on microaggressions in medical school: what are they and why should we care?
Perspect Med Educ. 2019;8(3):143-151.
doi:10.1007/S40037-019-0516-3
-
Ulloa JG, Talamantes E, Moreno G. Microaggressions during medical training.
JAMA. 2016;316(10):1,113-1,114.
doi:10.1001/jama.2016.11619


There are no comments for this article.