Background and Objectives: A decade ago, the Association of Family Medicine Residency Directors developed the Residency Performance Index (RPI) as a novel dashboard of metrics to support residency programs’ quality improvement efforts. Although the RPI has since been discontinued, we sought to identify lessons learned from an analysis of 6 years of data collected while the RPI was in use to inform future quality and accreditation efforts implemented at the national level.
Methods: The RPI collected data from 2012-2017 for nearly 250 distinct family medicine residency programs, identifying strengths and areas for improvement. Eighty-two programs provided data for 3 or more years of measures allowing analysis of improvement trends.
Results: For participating programs, aggregate data over 6 years indicated the majority had stable leadership and accreditation. Total family medicine center (FMC) visits by graduates and resident visit demographics were robust. Graduate scope of practice was consistent with nationally publicized trends. Programs hit most aspirational targets more than 40% of the time. However, analysis for those programs with 3 or more years of data revealed that the tool did not result in significant changes for most metrics. Linear regression analysis showed improvements in total patient visits, visits under 10 years of age, and certain procedural competencies for those programs with 3 or more years of data.
Conclusions: The RPI was the first and only nationally utilized family medicine graduate medical education quality improvement tool. Individual programs did not show substantial change in quantifiable metrics over time despite limited evidence of select programmatic improvements. Nationally, aggregated data provided insight into scope of practice and other areas of interest in residency training. Further efforts in provision of residency improvement tools are important to support programs given the increasing complexity and high stakes of family medicine residency education.
The Accreditation Council for Graduate Medical Education (ACGME) common program requirements require all programs to perform an annual program evaluation, that must include a systematic evaluation of curriculum, resident and graduate performance, faculty development, and program quality.1 It is therefore imperative for residency programs to engage in continuous program quality improvement. Pressures including duty-hour standards, a complex accreditation system, and threats of funding cuts have caused residency programs to justify their existence and defend the quality of the residents they produce.2
To improve quality, it is helpful to have accepted measures of excellence that exceed accreditation requirements.3 Regular monitoring of quality through report cards and dashboards has been shown to be effective at an institutional level.4,5 Standardized quality metrics and dashboards at a national, specialty-specific level currently do not exist. This is in part due to the disagreement on what constitutes quality educational metrics. Traditional educational metrics, such as board certification pass rates, entering trainee qualifications, scholarly activity, and research grants obtained by faculty, have some value.6 Criteria such as clinical performance measures of trainees, or graduates’ scope and quality of practice fit well with what patients value.7 Combinations of these two philosophies have also been suggested.8-10 Regardless of the proposed criteria, there has been little or no study of their effectiveness in improving residency program quality. In 2009, the Association of Family Medicine Residency Directors (AFMRD), a professional organization for family medicine program directors, developed a strategic plan that included the goal of raising the quality of postgraduate family medicine education in the United States. The AFMRD Board of Directors proposed the development of a dashboard-style tool, called the residency performance index (RPI), to help programs in the process of self-improvement.11,12 We have previously described the process to develop this tool and its initial successes and challenges.13,14 In 2018, the AFMRD Board made the decision to sunset the RPI due to insufficient return on investment as demonstrated by increasing software costs and staff time coupled with lack of growth in participation and only modest improvement in quality. This paper describes the lessons learned from an analysis of 6 years of data collected while the RPI was in use that can inform future quality and accreditation efforts implemented on a national level.
This paper elaborates on the learnings from the data collected using the RPI tool over the years 2012-2017 by 248 distinct family medicine residency programs, including a robust set of 82 programs that used the tool for 3 or more years. As not all programs were consistent in use year to year, the percentage of all accredited programs using the RPI per year ranged from 15 to 26. To our knowledge, this represents the most comprehensive data set for one specialty regarding voluntary tracking and program improvement efforts specifically targeted towards the outcomes desired by the new accreditation system. Our experience with using a tool such as this may help inform other specialties regarding the lessons learned around program improvement using peer-derived metrics in addition to accreditation standards.
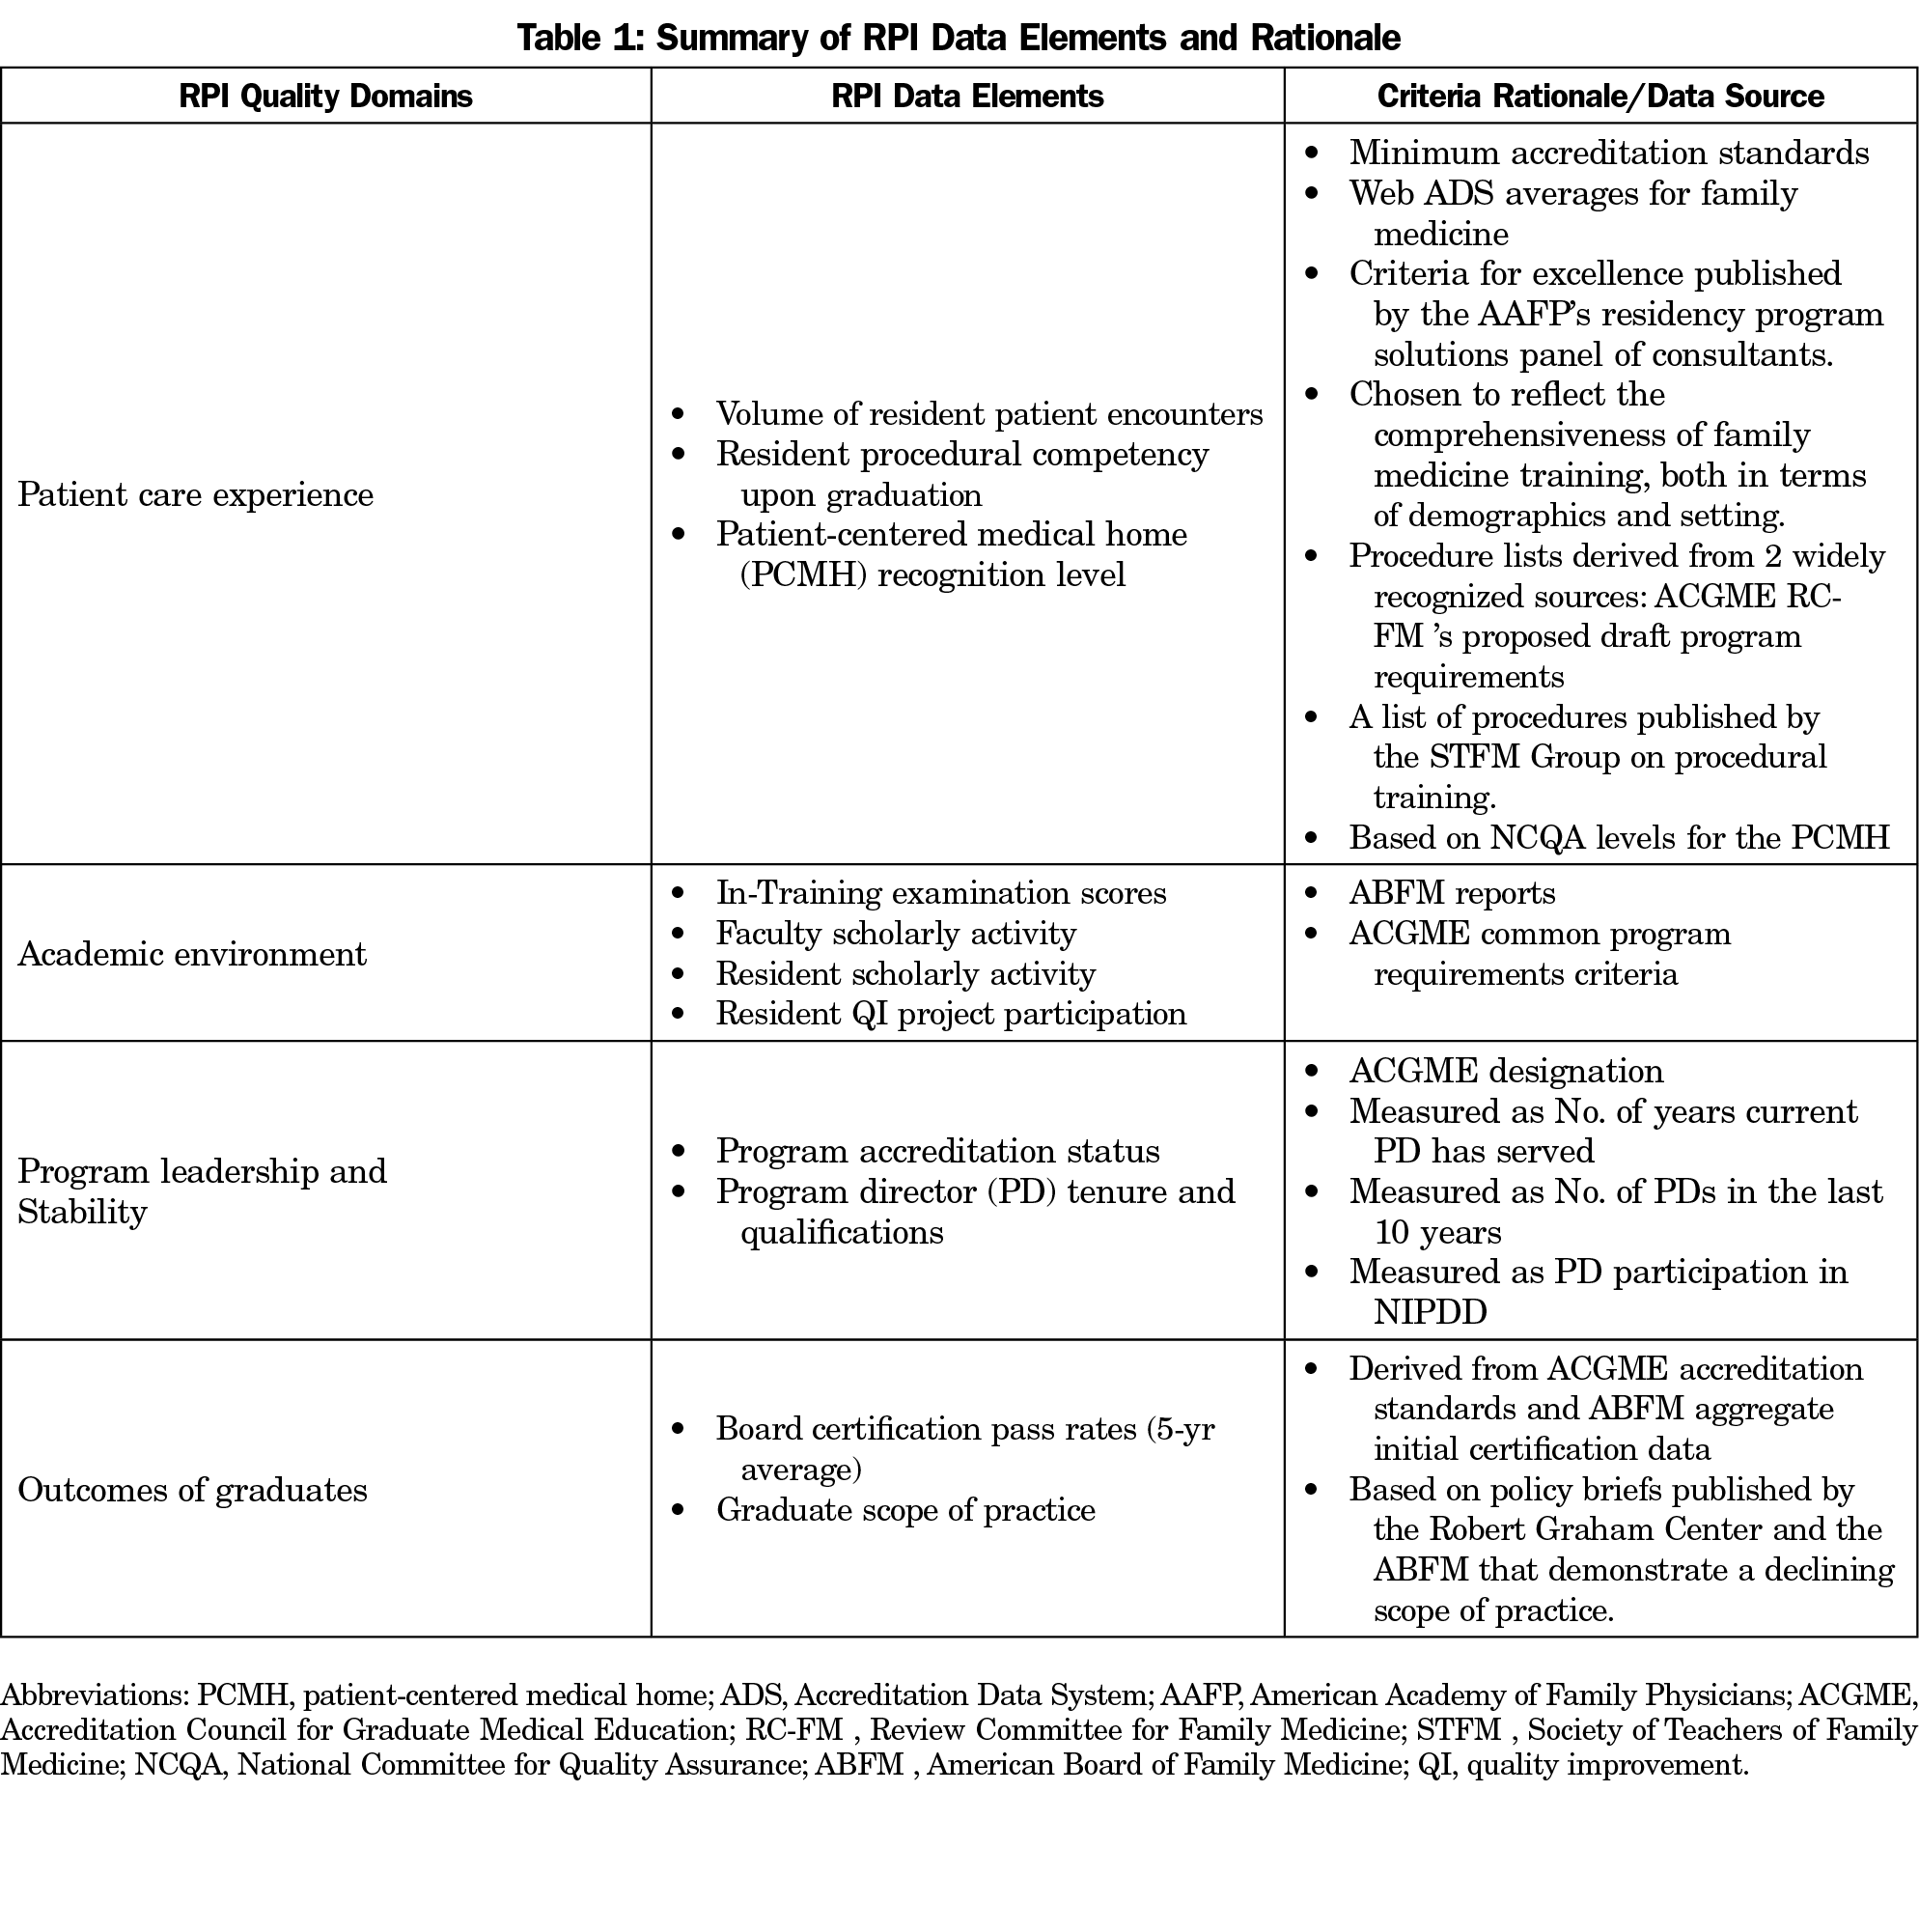
The RPI was developed by a committee of experienced program directors using a modified Delphi process. Criteria were included if: (1) the measures were relevant to accreditation standards published by the ACGME, board certification by the American Board of Family Medicine (ABFM), or reflected important aspects of graduate scope of practice; and (2) there was a published accreditation standard or basis in the literature for at least one of the chosen metrics.15-16 The resulting dashboard tool was intended to assist family medicine residency programs in identifying strengths and areas for improvement that could be analyzed and tracked. A convention of red, yellow, and green was chosen for the RPI, with green representing achievement of excellence in quality targets; yellow denoting adequate program quality for accreditation purposes but with room for improvement or caution; and red indicating metrics below accreditation standards, national norms, or targets promoted by family medicine professional organizations, based on published requirements or literature (Table 1).13,14
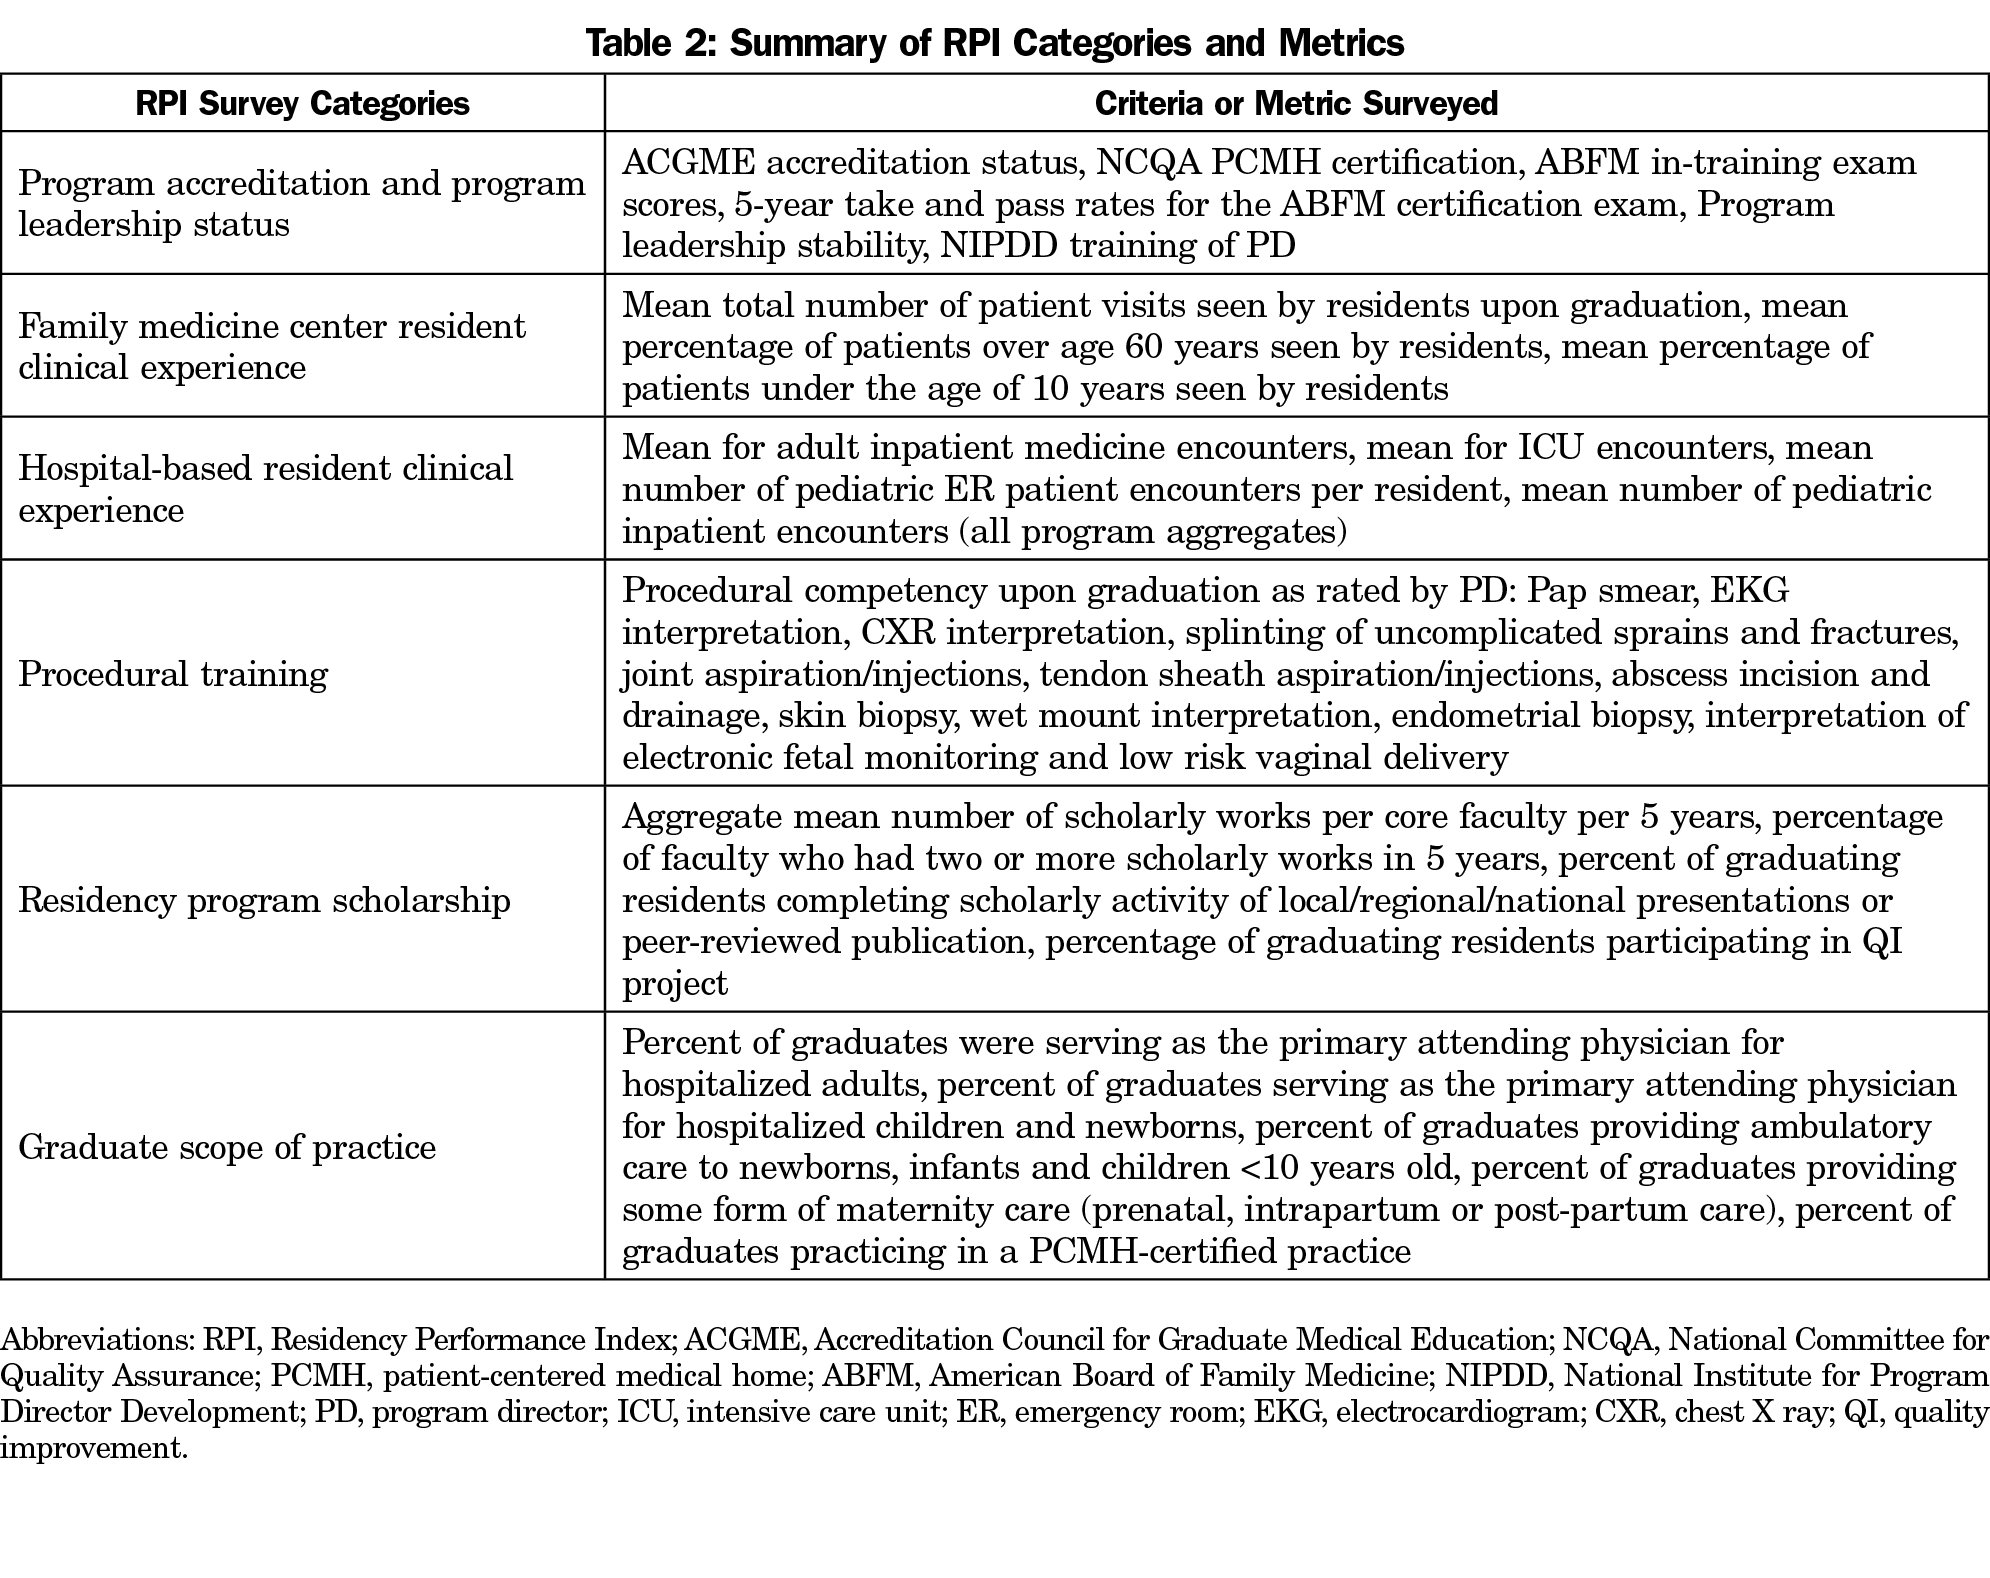
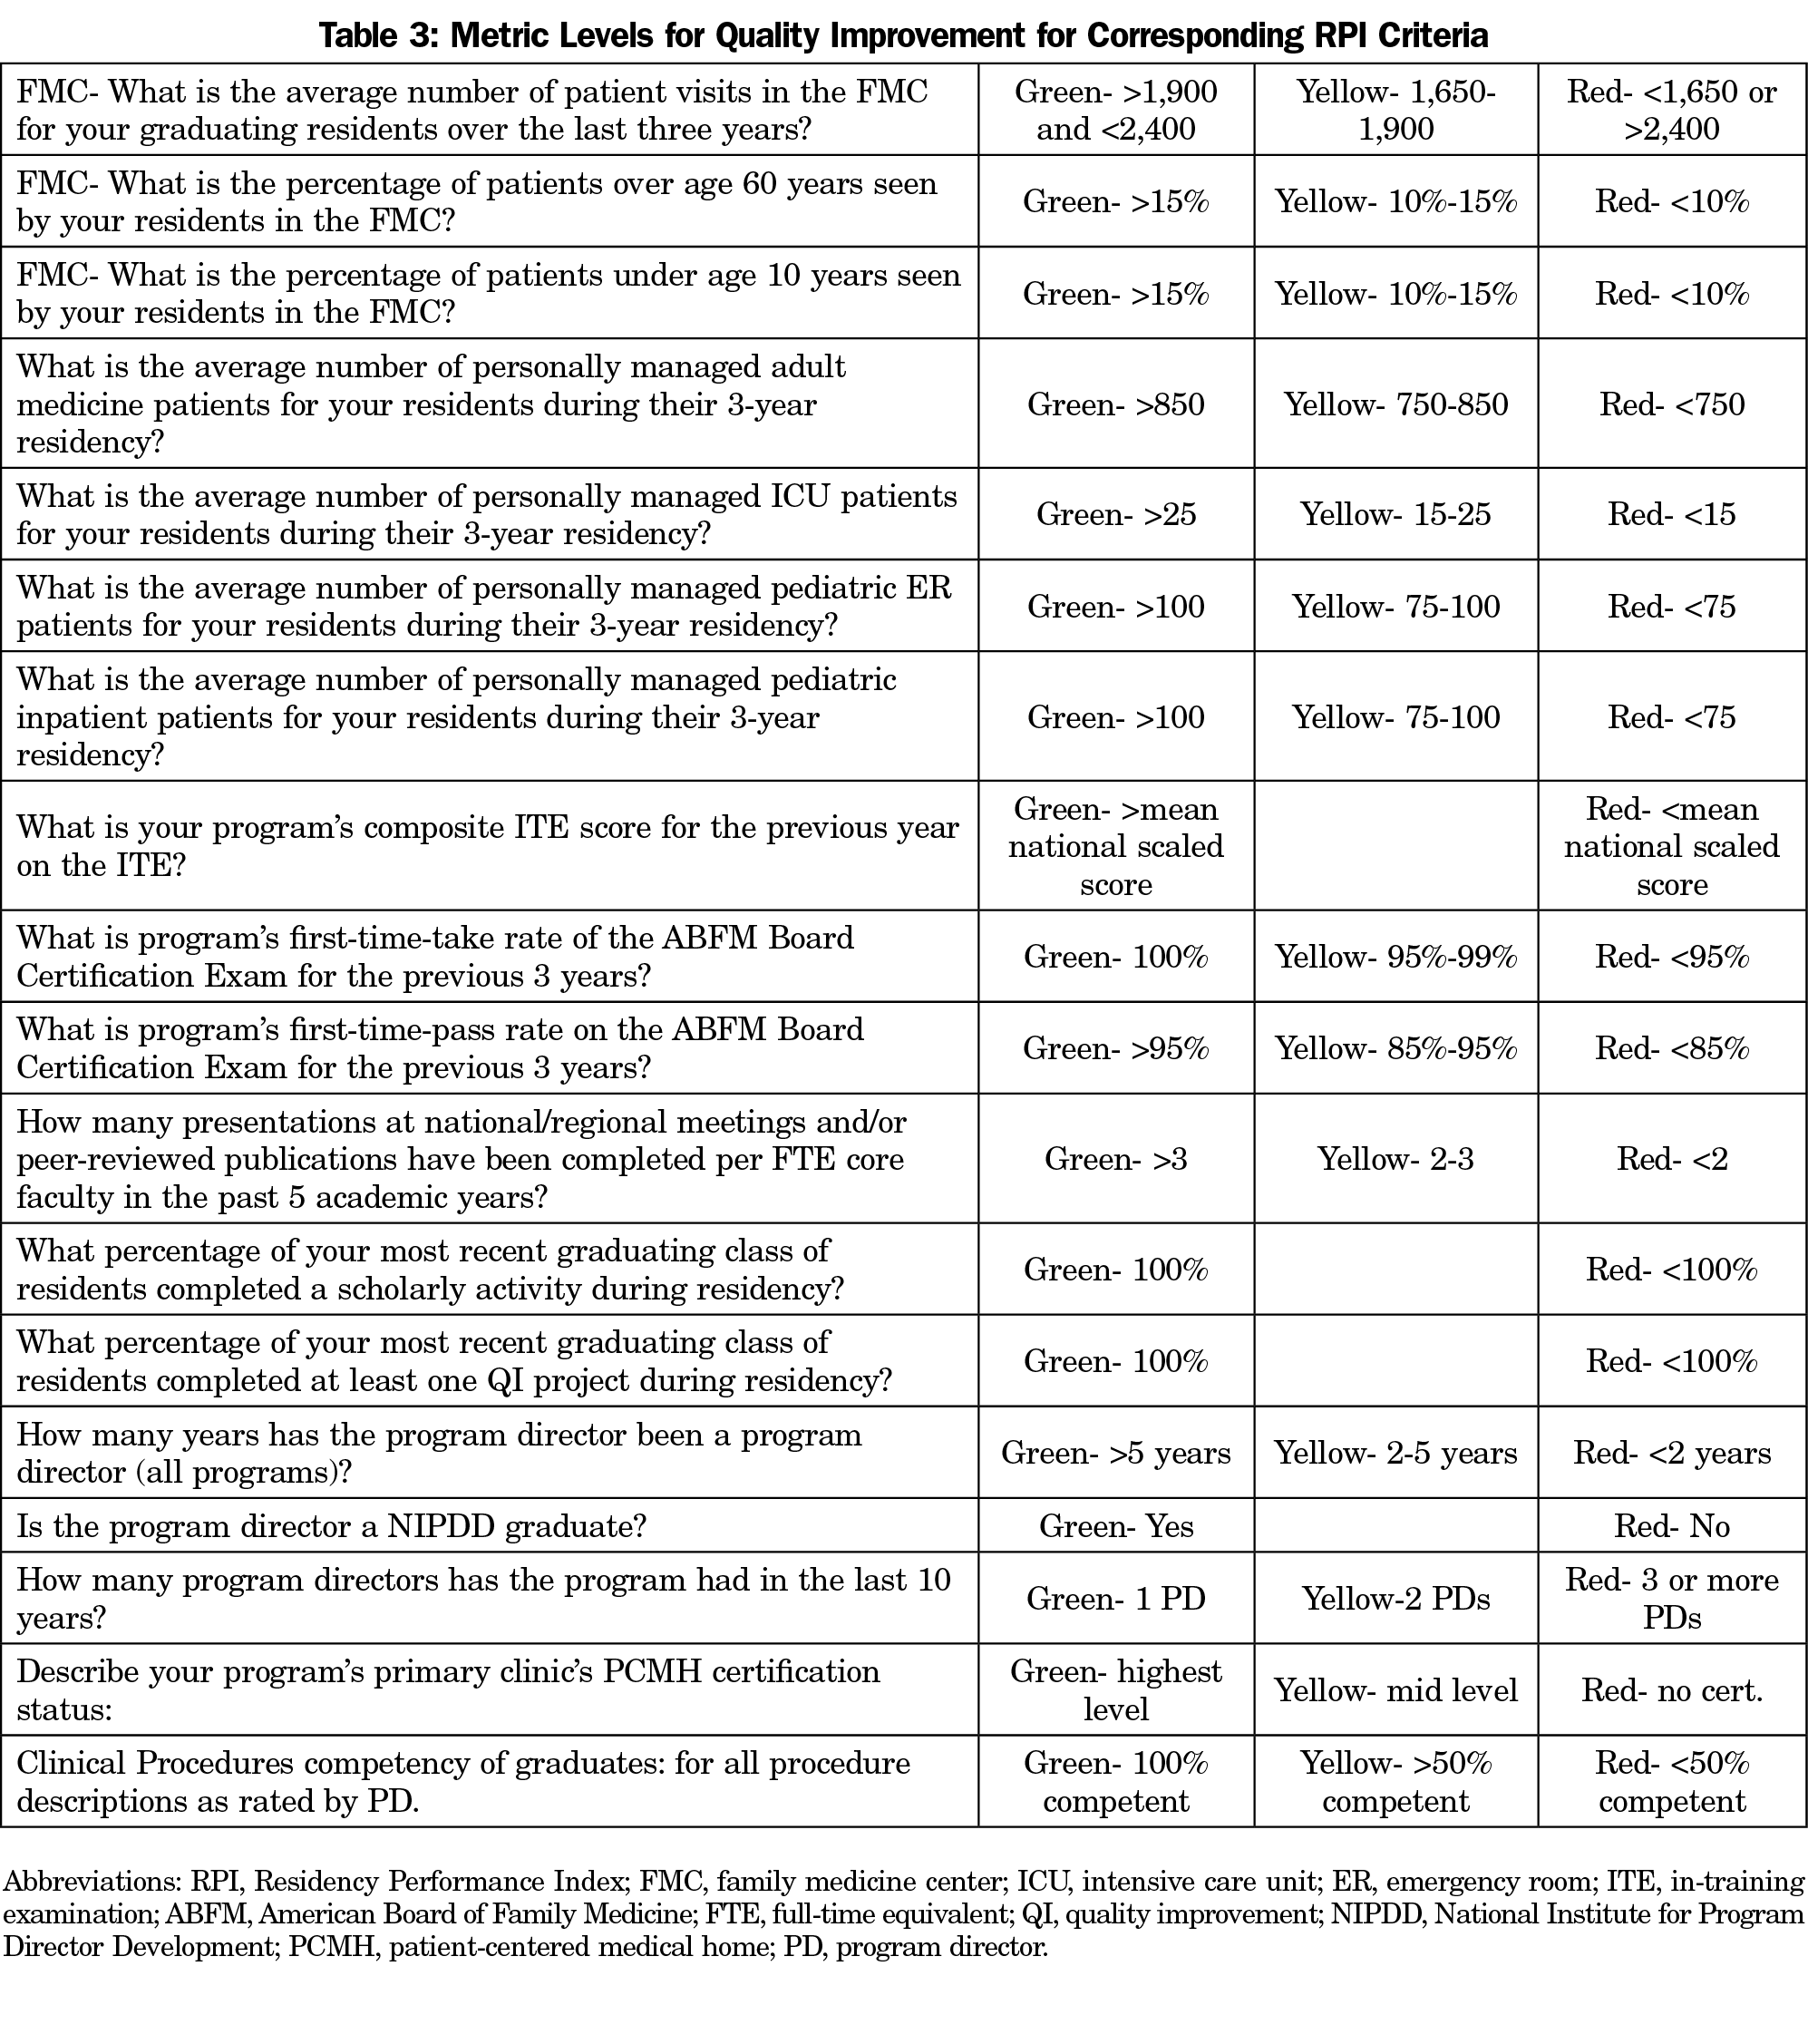
Analysis of the aggregate data for the 6 years (2012-2017) that the survey was active revealed that 646 program-years of data from 248 unique FM residency programs could be reliably extracted. Adjusting for minor variations in the wording of survey questions over the years, the data can be grouped into categories of questions: (1) program accreditation and program leadership status, (2) family medicine center (FMC) resident clinical experience, (3) hospital-based resident clinical experience, (4) procedural training, (5) residency program scholarship, and (6) graduate scope of practice. The RPI criteria and metrics for each of these six domains are listed in Tables 2 and 3. To understand the cohort of programs that participated in the RPI, the 6 years of aggregate data were analyzed regarding measures with published national trends.
We analyzed a cohort of 82 programs that had completed the RPI survey for 3 or more years for trends that would indicate improvement in key training metrics. We were able to analyze data from these programs for total FMC visits for graduates, percent of visits under the age of 10 years, and percent of visits over the age of 60 years, and for procedural competency upon graduation for several key procedures, including Pap smear, electrocardiogram interpretation, chest X-ray interpretation, splinting of uncomplicated sprains and fractures, joint injections, tendon sheath injections, abscess incision and drainage, skin biopsy, wet mount interpretation, endometrial biopsy, interpretation of electronic fetal monitoring and low-risk vaginal delivery. The percentage of programs achieving green criteria for each of these metrics was calculated using these 82 programs.
We also conducted χ2 analysis to compare the counts of all 82 organizations falling in red, yellow, and green criteria across all years. We conducted an additional χ2 analysis combining green and yellow categories compared to the counts of organizations with red values. In addition, we conducted a linear regression on the three metrics related to FMC visits and 14 procedural competencies in effort to examine the slope percentage of programs in the red, looking for a decrease over time.
For all analyses, both χ2 and linear regression, a P value less than .05 was considered to be statistically significant. This was an unadjusted analysis since not all organizations replied or gave responses in each year. The American Academy of Family Physicians Institutional Review Board Office exempted this study from review.
Aggregate data around national trends revealed that the majority of RPI participants had stable accreditation, program leadership, and patient-centered medical home (PCMH) designation. The average ABFM mean scaled program in-training exam scores for the surveyed program years were at or slightly above the national mean in four of 6 years.18 For all programs, the mean 5-year take and pass rates for the ABFM certification exam were 97.5% and 93.5%, respectively.
In terms of FMC resident clinical experience, the mean number of patient visits seen by residents upon graduation was 1,882 over the 6 years (ACGME national mean=1,825).19 The mean percentage of patients over the age of 60 years seen by residents was 18.1%, and the mean percentage of patients under the age of 10 years seen by residents was 15.1%, at a time when accreditation standards required a minimum of 10% of patients seen by residents be in these demographic groups.20
Regarding hospital-based resident clinical experience, the aggregate mean for adult inpatient medicine encounters was 901.3 per resident over 3 years. The aggregate mean for intensive care unit encounters was 80.1 per resident over 3 years. The mean number of pediatric emergency room (ER) patient encounters per resident was 118.8 over 3 years. The mean number of pediatric inpatient encounters was 187.9 per resident over 3 years. The ACGME requirements for these experiences during the years the data were collected were 750 adult medicine encounters, 75 pediatric ER, and 75 pediatric inpatient encounters over 3 years.20
For the years 2012-2015, the aggregate mean number of scholarly works per core faculty per 5 years was 9.6, which was defined as national or regional presentations or peer-reviewed publications. In 2016-2017 the survey asked what percentage of faculty had two or more scholarly works in 5 years as defined above, and roughly half of the aggregate responses (50.7%) indicated this was the case for their core faculty. For resident scholarship, a mean of 77.8% of graduating residents had completed scholarly activity that involved local/regional/national presentations or peer-reviewed publication, per the aggregate data over 6 years. In addition, programs reported that on aggregate, 95.2% of graduating residents participated in at least one QI project, using a plan-do-study-act cycle or similar functional strategy.
Under the category of graduate scope of practice, the data were limited to 472 program years of responses or less per question, due to these questions being optional. Despite those limitations, the aggregate data revealed that a mean of 36% of graduates were serving as the primary attending physician for hospitalized adults; 26.3% were doing the same for hospitalized children and newborns. A mean of 78.1% of the aggregate graduates with scope of practice information available, provided ambulatory care to newborns, infants and children under age 10 years; 23.3% of the same pool of graduates were providing some form of maternity care (prenatal, intrapartum or postpartum care). While only 259 program years of responses were available for the question, an aggregate mean of 35.9% of graduates were practicing in a PCMH-certified practice.
From the database, 248 organizations provided at least 1 year of data in the period of data from 2012 to 2017. Since not all of these programs completed the RPI during each year, only approximately 15% to 26% of all accredited family medicine residencies completed the RPI in a given year. Of those organizations, 82 had data that met the inclusion criteria of 3 or more years of data for further analysis. The percentage of these 82 programs that were consistently green for FMC demographic metrics in each year revealed more than 40% of programs achieved this level on average. Similar results were found for procedures, in that the percentage of the 82 programs in the green were also more than 40% of the total in each year over time.
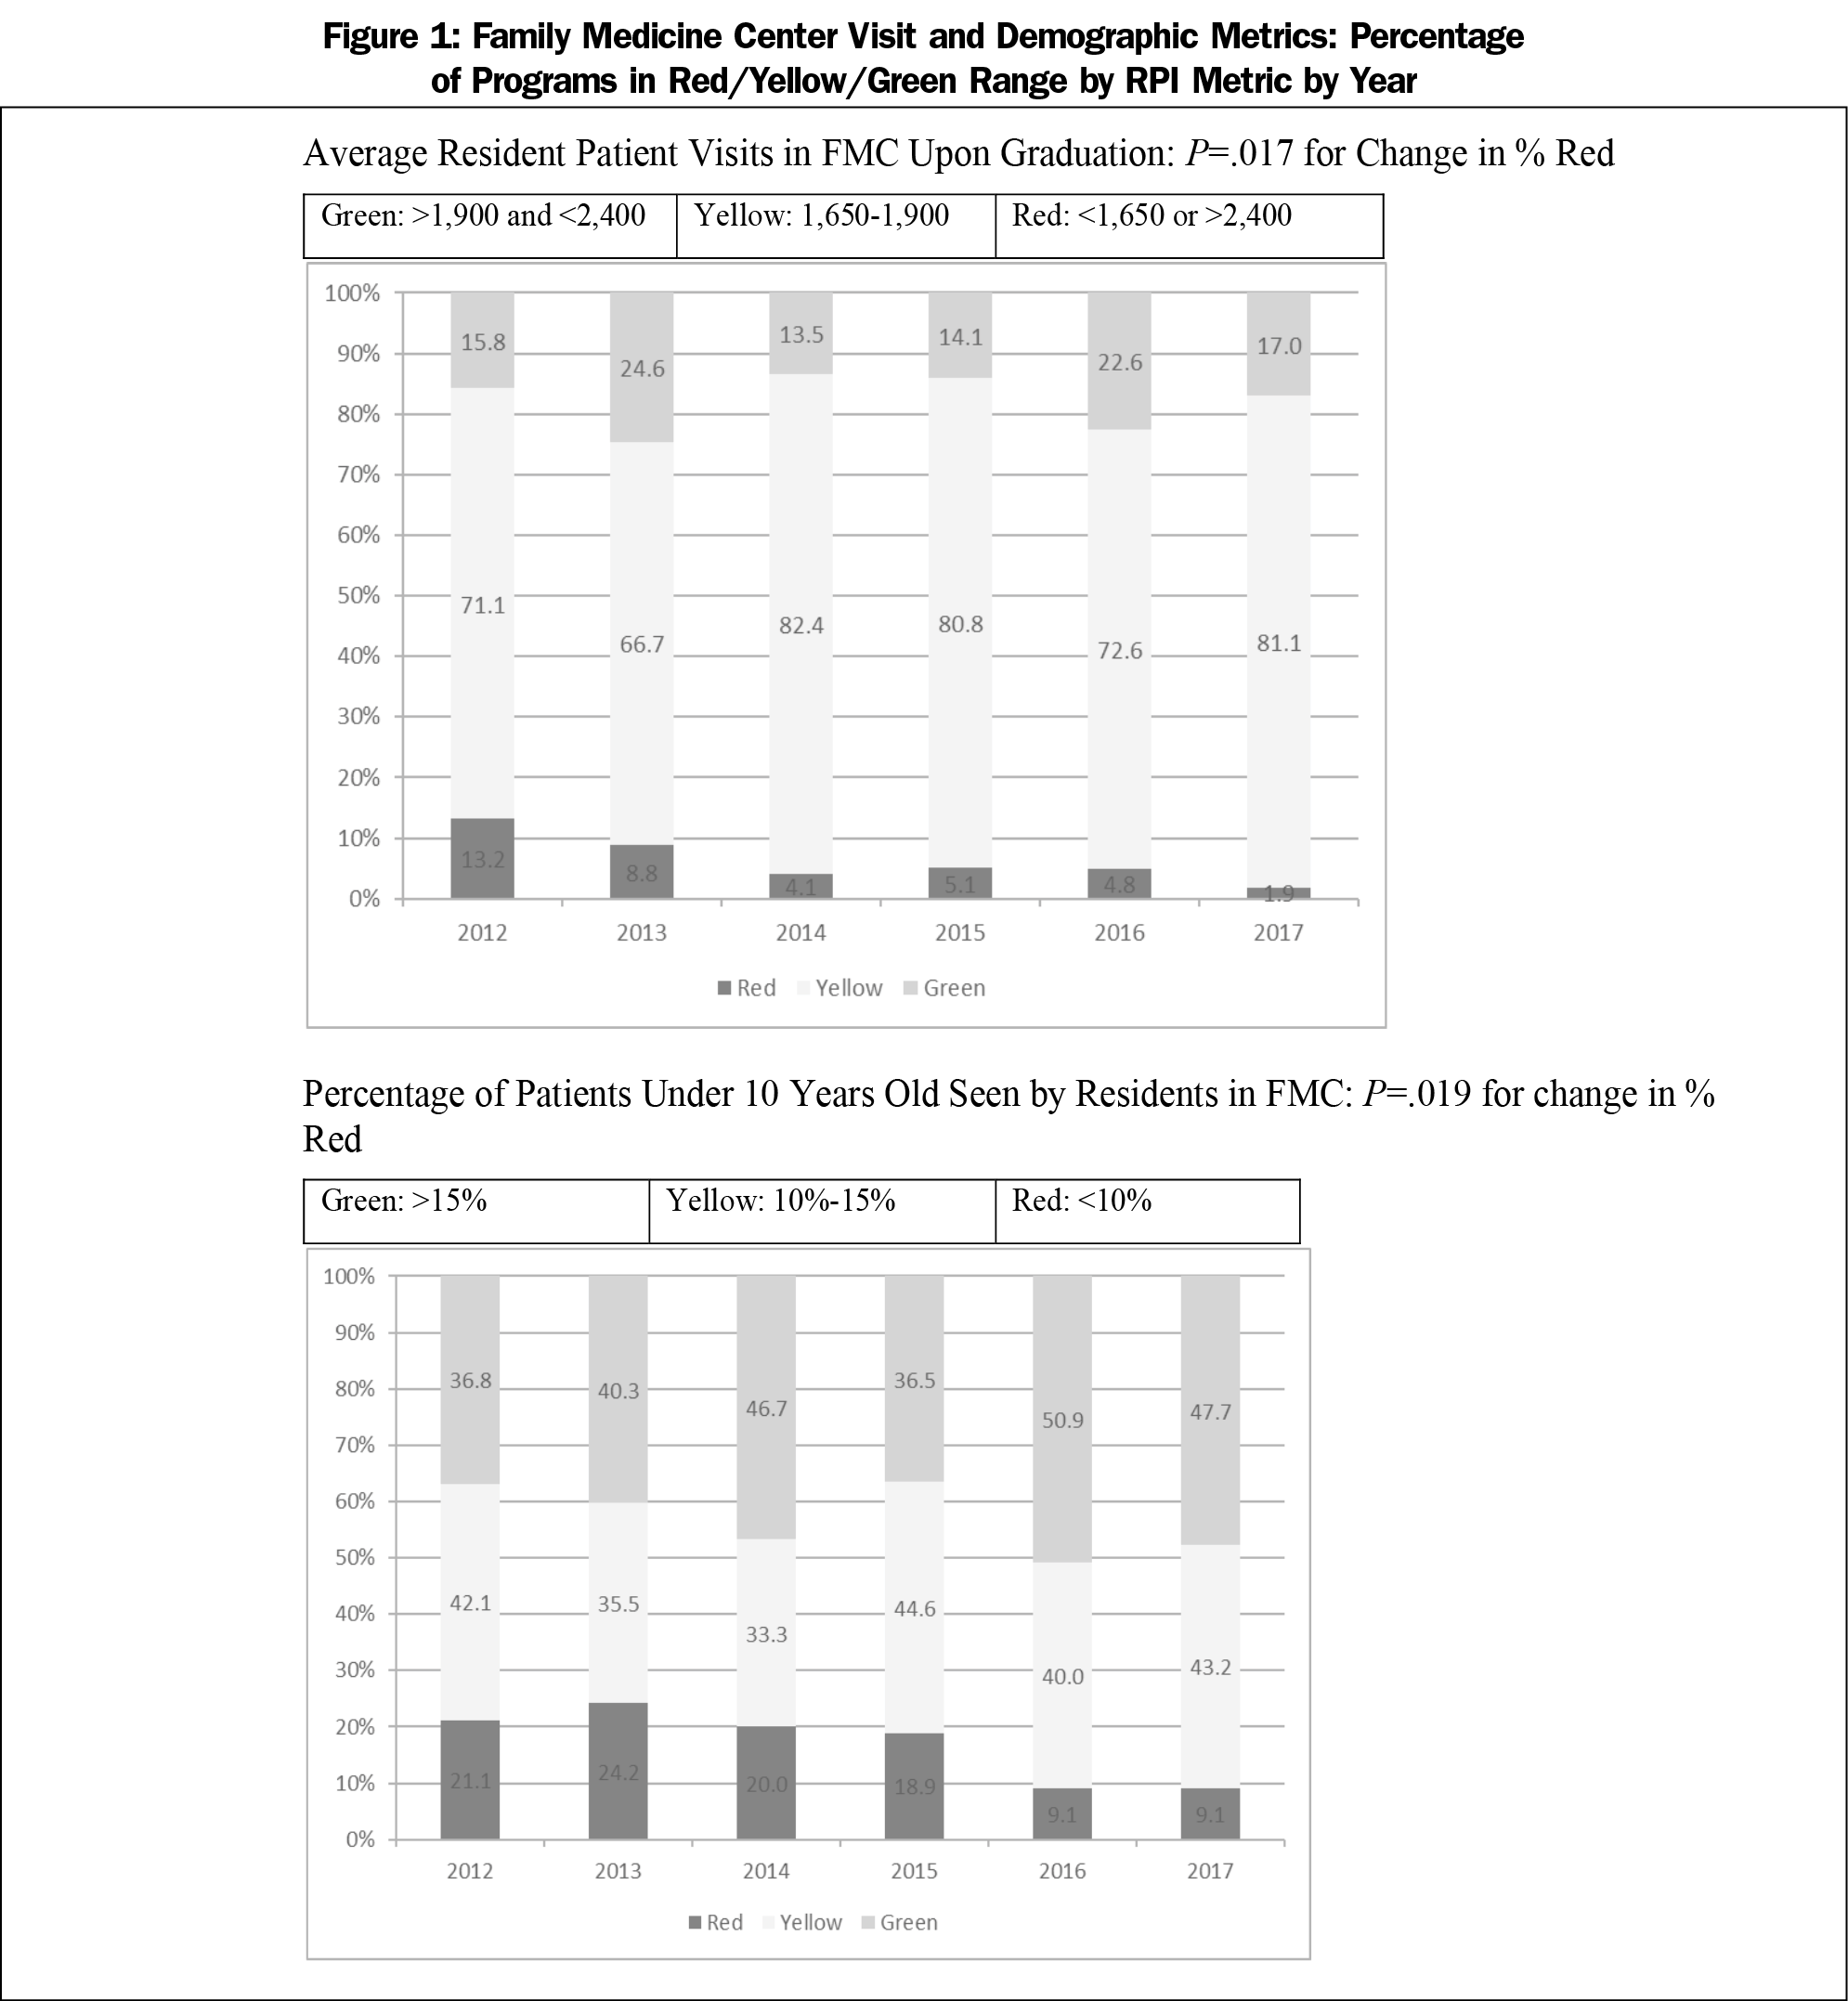
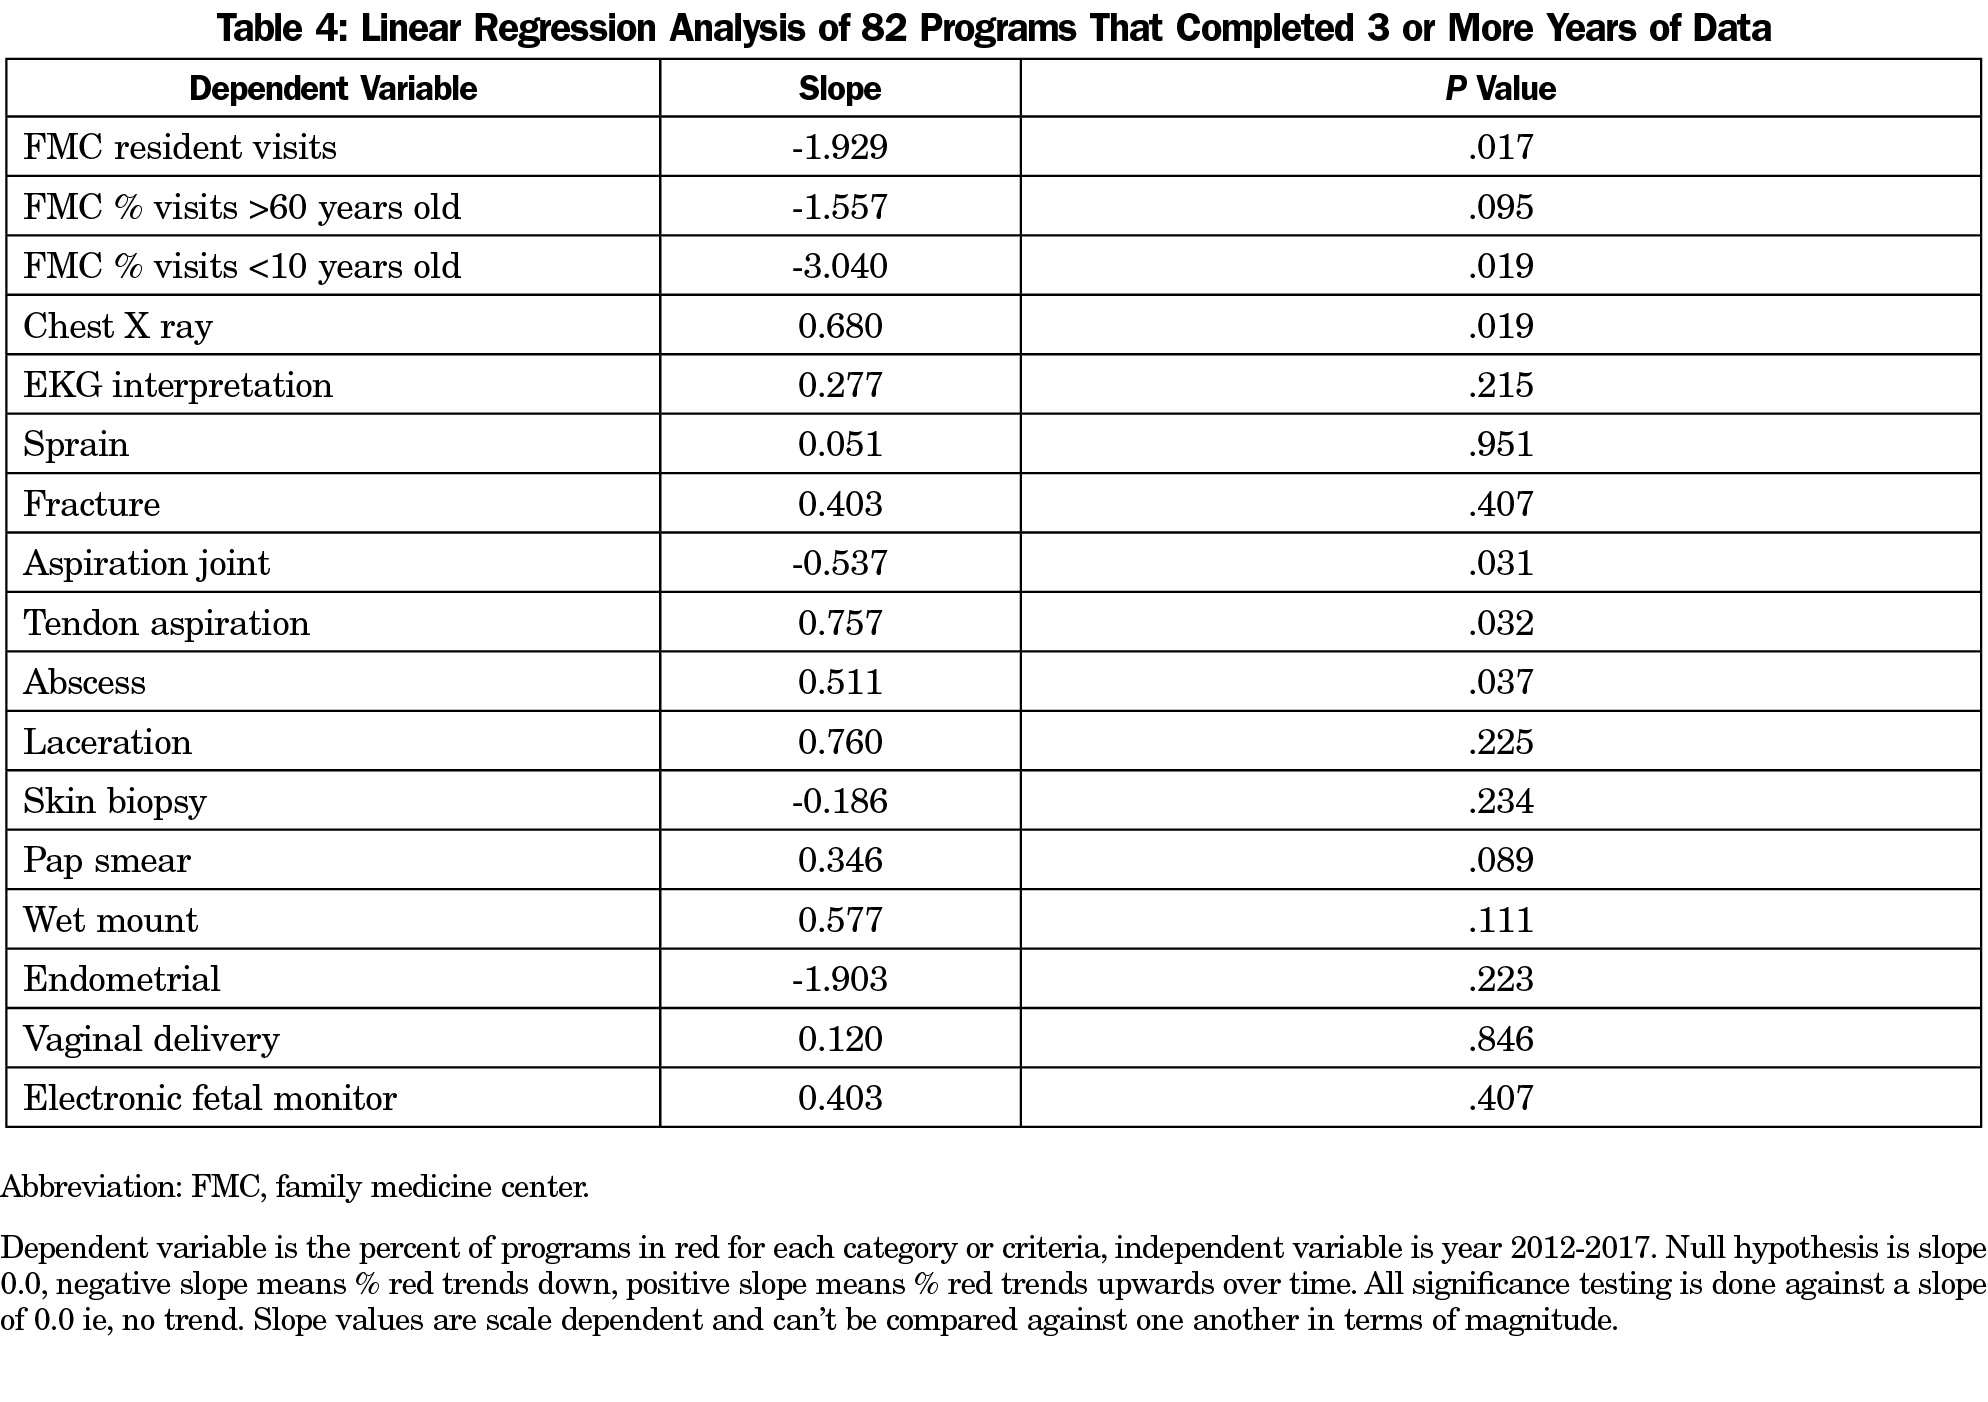
The results of the linear regression analysis demonstrated for FMC data that the proportion of red decreased over time, reaching statistical significance twice: first for total patient visits (slope= -1.929, P=.017), and percentage of patients seen under 10 years of age (slope= -3.040, P=.019; Figure 1. Three of the procedures also demonstrated down trend for programs in the red: joint aspiration (P=.031), skin biopsy (P=.234) and endometrial biopsy (P=.223). Three slopes for procedures were found to worsen over time. Chest X ray (P=.019), tendon sheath aspiration (P=.032) and incision and drainage of skin abscess (P=.037) were shown to have increasing slope values. However, those procedures had low percentages of programs in the red to begin with (Table 4).
Analysis of green and yellow trends over time showed that there was no improvement in the percentage of these 82 programs achieving a green level for the metrics over the 6 years, nor was there any significant change in the percentage of these same programs when the green and yellow categories were combined.
Over the 6 years of implementation, AFMRD’s Residency Performance Index was used by almost 250 family medicine residency programs. The primary intent of this endeavor was to provide a dashboard-style tool to enhance program improvement efforts using metric levels above minimal accreditation standards. Providing programs with aspirational metrics related to program stability, scholarship, resident clinical experiences, procedural training, and encouraging the tracking of graduate scope of practice, resulted in the accumulation of a rich data set.
The aggregate data revealed the diversity of family medicine program performance characteristics. Most programs had stable accreditation. Program leadership spanned the spectrum of stability, but regardless of length of tenure, the majority had utilized the National Institute for Program Director Development fellowship as a means of preparation for the role. Most programs had robust clinical experiences in the FMC and hospital setting that exceeded minimum accreditation standards. Procedural training showed similar trends regarding overall assessments of competency upon graduation. Program scholarship that promoted dissemination through peer-reviewed publication and regional or national meetings was also achieved by the majority of core faculty and residents. Quality improvement was performed using functional strategies by the overwhelming majority of residents in the programs reporting.
The outcomes of training, as determined by graduate scope of practice, was an optional part of the dashboard tool, and therefore the data was not as robust and likely less reliable. Despite these limitations, it appeared that program graduates were participating in a broad scope of practice at levels that mirrored or exceeded published national trends.21-27
The RPI was ostensibly designed to be a tool to promote program self-improvement efforts in line with the ACGME’s roll out of the next accreditation system (NAS), which implemented a 10-year self-study process as the basis for continued accreditation. By giving programs aspirational targets for metrics around several accreditation domains, the RPI sought to spur the greater family medicine residency community to strive to exceed minimum standards.11,12 Our analysis of the 82 programs with 3 or more years of RPI data revealed that the tool did not result in significant changes for most metrics. Although approximately 40% of the 82 programs with longitudinal data available for analysis consistently achieved aspirational (green) targets for most of the metrics, there were not significant improvements in the percentage of programs achieving those targets over time. However, there were improvements seen in a several clinical experiences and procedural competencies, as manifested by the significant declines in the percentage of programs in the red range. This was seen for overall visits and pediatric visits by residents in the FMC, as well as for certain procedural competencies (joint injections, skin biopsy and endometrial biopsy). A few procedural competencies had statistically significant increases in the percentage of programs in the red range (chest X-ray interpretation, tendon sheath aspiration, and incision and drainage of skin abscess), but the absolute change in percentages were so low that it is difficult to determine the educational significance of this finding.
This study has several limitations. First and foremost, the RPI was a voluntary undertaking, so our data set, while robust, still only represented approximately one-quarter of family medicine residencies accredited in any given year during the time the tool was offered. Voluntary participation was also complicated by concerns that program data would be used as a ranking tool rather than an improvement tool. Although this concern was addressed through signed agreements between programs and AFMRD, it likely contributed to low participation. Second, the data relied heavily on program director reporting, which could have recall bias when reporting data related to program quality. Third, the wording of the questions from year to year was subtly different for several metrics, which could have influenced the reported results. As noted, the tool did not result in significant change for most of the metrics, which could be due to the measurement itself not discriminating, as what we measure and what is meaningful may not be the same. Finally, the number of programs that completed data in 3 or more years was relatively small and therefore data on trend analysis was less robust than other aspects of the data set.
Overall, the authors feel that the RPI demonstrated the difficulty of performing quality improvement activity in a complex system such as a residency training program. The inertia to achieve continued accreditation may have limited programs from seeing any value in trying to attain the aspirational (green) targets set by the RPI task force. Despite this, several areas saw statistically significant drops in the percentage of programs that reported data that did not meet minimum accreditation standards for FMC clinical experience.
When RPI started in 2012, the use of academic and clinical dashboards in family medicine residencies was far less common than it is today.4,5,12,28 During the RPI period, collecting data was also more labor-intensive and less automated than it is now. RPI-like efforts may be logistically easier in the future as dashboarding and data collection become more automated and sophisticated. Similar interresidency benchmarking projects may be more easily achieved across programs using the same electronic health record or by interstate educational consortia in large consolidated health systems. Areas for further study could include a qualitative survey of program directors’ perceptions of the impact of a future RPI-like tool on increasing their program’s quality (that may not be captured quantitatively), and whether a future RPI-like tool is used for internal advocacy purposes within institutions to obtain additional resources needed to achieve a higher standard than accreditation only.4,5,12,28 Additionally, the ACGME’s New Accreditation System’s requirements for programs to perform a 10-year self-study, using annual program evaluations and improvement plans will benefit from tools such as the RPI, tracking performance over time using internal and external benchmarked measures.1,28
Ultimately, the value of the RPI experience may be in what was learned in trying to spur a specialty to improve residency training as a group enterprise. The perceived benefits of striving to achieve a national metric may diminish if programs are more focused on achieving local, program-specific goals such as needs of their population and community mission. The diversity of family medicine residency programs will make proposing any future targets of excellence an exercise that must focus on core values and a scope of practice that has demonstrated benefits on population health.29,30 The upcoming process to write major revisions of the ACGME Family Medicine Program Requirements will be a prime opportunity for the discipline to engage its community on where to set the next bar in family medicine residency education.31
The RPI tool, as used by nearly 250 FM programs over 6 years, demonstrated that most family medicine programs were able to achieve target metrics that exceeded minimum accreditation standards or consensus best practices in residency training. Those programs that used the tool for 3 or more years did not show significant increases in attaining aspirational targets but did improve in decreasing the percentage that risked not meeting accreditation standards for select metrics. The thrust of the RPI tool, to promote commitment to program improvement through measurement and aspirational targets, was not successful. The majority of programs could not sustain the effort and for those who did, not much changed, once again proving that change is hard, and collectively improving residency program quality above minimal accreditation standards is even harder. Understanding the substantial challenges in implementing this specialty-wide program improvement process is critical to informing the development of future accreditation standards.32
Acknowledgments
The Authors thank Dr Tom Wasser for his help with data analysis and statistical computations.
Financial support: The Association of Family Medicine Residency Directors provided support for statistical analysis.
Presentations: The introduction, concept, and use of the RPI was presented at the American Academy of Family Physicians Program Directors Workshow/Residency Program Symposium 2012, 2014, 2016, and STFM Annual Spring Conference in 2013.
References
- Accreditation Council for Graduate Medical Education. ACGME Common Program Requirements. https://acgme.org/Portals/0/PFAssets/ProgramRequirements/CPRResidency2019.pdf. Accessed 2013.
- Hackbarth G, Boccuti C. Transforming graduate medical education to improve health care value. N Engl J Med. 2011;364(8):693-695. doi:10.1056/NEJMp1012691
- Iverson DJ. Meritocracy in graduate medical education? Some suggestions for creating a report card. Acad Med. 1998;73(12):1223-1225. doi:10.1097/00001888-199812000-00008
- Andrada J, Teo J, Neo J, Yeo H, Leng LB. Putting time in perspective: an integrated graduate medical education institutional dashboard and report card. J Grad Med Educ. 2019;11(4)(suppl):169-176. doi:10.4300/JGME-D-18-00482
- Huntington J, Dick JF III, Ryder HF. Achieving educational mission and vision with an educational scorecard. BMC Med Educ. 2018;18(1):245. doi:10.1186/s12909-018-1354-4
- Murray PM, Valdivia JH, Berquist MR. A metric to evaluate the comparative performance of an institution’s graduate medical education program. Acad Med. 2009;84(2):212-219. doi:10.1097/ACM.0b013e3181939705
- Asch DA, Epstein A, Nicholson S. Evaluating medical training programs by the quality of care delivered by their alumni. JAMA. 2007;298(9):1049-1051. doi:10.1001/jama.298.9.1049
- Giudice E, Carraccio C. Best evidence calling for educational reform: will we do the right thing? J Grad Med Educ. 2011;3(4):577-579. doi:10.4300/JGME-D-11-00127.1
- Klessig JM, Wolfsthal SD, Levine MA, et al. A pilot survey study to define quality in residency education. Acad Med. 2000;75(1):71-73. doi:10.1097/00001888-200001000-00018
- Rose SH, Long TR. Accreditation Council for Graduate Medical Education (ACGME) annual anesthesiology residency and fellowship program review: a “report card” model for continuous improvement. BMC Med Educ. 2010;10(1):13. doi:10.1186/1472-6920-10-13
- Hoekzema G, Abercrombie S, Carr S, et al. Residency “dashboard”: family medicine GME’s step towards transparency and accountability. Ann Fam Med. 2010;8:470. doi:10.1370/afm.1181
- Association of Family Medicine Directors. Year-2 (2011–2012), September 2011 Strategic plan update. Leawood, KS: AFMRD; 2011. http://www.afmrd.org/files/AFMRD_Stategic_Plan_Revised_September_2011_SV.pdf. Accessed August 9, 2013.
- Hoekzema GS, Maxwell L, Gravel JW Jr, Mills WW, Geiger W. The residency performance index: an effort at residency quality assessment and improvement in family medicine. J Grad Med Educ. 2014;6(4):756-759. doi:10.4300/JGME-D-13-00355.1
- Hoekzema GS, Maxwell L, Gravel JW Jr, Mills WW, Geiger W, Honeycutt JD. Quality assessment and improvement of post graduate family medicine training in the USA. Educ Prim Care. 2016;27(5):386-390. doi:10.1080/14739879.2016.1218299
- American Academy of Family Physicians. The Residency Program Solutions Criteria for Excellence. 8th ed. Leawood, KS: AAFP; 2011. http://www.aafp.org/rps. Accessed 2012
- Nothnagle M, Sicilia JM, Forman S, et al; STFM Group on Hospital Medicine and Procedural Training. Required procedural training in family medicine residency: a consensus statement. Fam Med. 2008;40(4):248-252.
- Accreditation Council for Graduate Medical Education. Scholarly Activity Guidelines Review Committee for Family Medicine. https://www.acgme.org/Portals/0/PFAssets/ProgramResources/120_scholarly-activity-guidelines.pdf. Accessed 2013.
- O’Neill TR, Peabody MR. In-Training Examination Score Results Handbook (2012-17 editions). Lexington, KY: American Board of Family Medicine; 2017.
- Accreditation Council for Graduate Medical Education. National Family Medicine Annual Data Summary Report (2012-2017). https://apps.acgme.org/ads. Accessed August 26, 2020.
- Accreditation Council for Graduate Medical Education. ACGME family medicine program requirements. https://www.acgme.org/Portals/0/PFAssets/ProgramRequirements/120_FamilyMedicine_2012.pdf. Accessed 2013.
- Kruse J. The patient-centered medical home: a brief educational agenda for teachers of family medicine. Fam Med. 2013;45(2):132-136.
- Newton WP. Family physician scope of practice: what it is and why it matters. J Am Board Fam Med. 2011;24(6):633-634. doi:10.3122/jabfm.2011.06.110262
- Tong ST, Makaroff LA, Xierali IM, et al. Proportion of family physicians providing maternity care continues to decline. J Am Board Fam Med. 2012;25(3):270-271. doi:10.3122/jabfm.2012.03.110256
- Blanchette H. The impending crisis in the decline of family physicians providing maternity care. J Am Board Fam Med. 2012;25(3):272-273. doi:10.3122/jabfm.2012.03.120048
- Bazemore AW, Petterson S, Johnson N, et al. What services do family physicians provide in a time of primary care transition? J Am Board Fam Med. 2011;24(6):635-636. doi:10.3122/jabfm.2011.06.110171
- Coutinho AJ, Cochrane A, Stelter K, Phillips RL Jr, Peterson LE. Comparison of intended scope of practice for family medicine residents with reported scope of practice among practicing family physicians. JAMA. 2015;314(22):2364-2372. doi:10.1001/jama.2015.13734
- Rayburn W. Who will deliver the babies? Identifying and addressing barriers. J Am Board Fam Med. 2017;30(4):402-404. doi:10.3122/jabfm.2017.04.170197
- Stansfied RB, Markova T, Baker R. Integration of continuous quality improvement methods into annual program and institutional evaluation. J Grad Med Educ. 2019;11(5):585. doi:10.4300/JGME-D-19-00145.1
- WONCA Working Party on Education. WONCA Global Standards for Postgraduate Family Medicine Education. World Organization of Family Doctors; June 2013. http://www.globalfamilydoctor.com/site/DefaultSite/filesystem/documents/Groups/Education/WONCA%20ME%20stds_edit%20for%20web_250714.pdf. Accessed 2015
- American Academy of Family Physicians. RPS Criteria for Excellence, 12th Edition. Leawood, KS: AAFP; 2020.
- Newton WP, Bazemore A, Magill M, et al. The future of family medicine residency training is our future: a call for dialogue across our c.ommunity. J Am Board Fam Med 2020;33:636–640.
- Joober R, Schmitz N, Annable L, Boksa P. Publication bias: what are the challenges and can they be overcome? J Psychiatry Neurosci. 2012;37(3):149-152. doi:10.1503/jpn.120065


There are no comments for this article.