Background and Objectives: Although rural family medicine residency programs are effective in placing trainees into rural practice, many struggle to recruit students. Lacking other public measures, students may use residency match rates as a proxy for program quality and value. This study documents match rate trends and explores the relationship between match rates and program characteristics, including quality measures and recruitment strategies.
Methods: Using a published listing of rural programs, 25 years of National Resident Matching Program data, and 11 years of American Osteopathic Association match data, this study (1) documents patterns in initial match rates for rural versus urban residency programs, (2) compares rural residency match rates with program characteristics for match years 2009-2013, (3) examines the association of match rates with program outcomes for graduates in years 2013-2015, and (4) explores recruitment strategies using residency coordinator interviews.
Results: Despite increases in positions offered over 25 years, the fill rates for rural programs have improved relative to urban programs. Small rural programs had lower match rates relative to urban programs, but no other program or community characteristics were predictors of match rate. Match rates were not indicative of any of five measures of program quality nor of any single recruiting strategy.
Conclusions: Understanding the intricacies of rural residency inputs and outcomes is key to addressing rural workforce gaps. Match rates likely reflect challenges of rural workforce recruitment generally and should not be conflated with program quality.
Although rural family medicine residency programs are effective in preparing and placing trainees into rural practice, 1, 2 many struggle to recruit students to their programs. The declining number of students interested in family medicine has added to that challenge. 3 These difficulties have persisted in varying degrees over time and are important to study longitudinally and set in historical context. 3-5
Students in their final year of medical school interview with residency programs, after which students and programs enter their respective rank lists into the National Residency Matching Program (NRMP, or “the match”). 6 A computer algorithm makes a match, announced in March before residency training starts in July. The ratio between the number of positions offered and filled in the main match is known as the “initial match rate.” In 2021, family medicine residencies filled 92.8% of 4,844 positions offered in the initial match. 7
Students who do not match and programs that do not fill their offered positions in the initial match can participate in the Supplemental Offer and Acceptance Program (SOAP) to fill remaining positions. 8 SOAP is a rapid online process with interviews compressed into 2 to 3 days, allowing programs to acquire candidates who also failed to match. In 2021, of all family medicine positions offered, rural and urban, only eight were still unfilled immediately post-SOAP.9
The NRMP system for residencies accredited by the Accreditation Council for Graduate Medical Education (ACGME) recently has incorporated osteopathic programs that had participated in a separate American Osteopathic Association (AOA) match but now have acquired ACGME accreditation under a single accreditation system. A single annual match for all US and international medical school graduates began in 2020.
Comparing NRMP and AOA match data is important but challenging. The AOA match was designed only for osteopathic medical students and AOA-accredited programs, and a lower fill rate as compared to NRMP was expected for several reasons. Before the single match, the AOA match date generally preceded the NRMP match by several weeks. Dually-accredited programs (ie, accredited by both ACGME and AOA) could roll over unfilled positions from the AOA match to the NRMP. Programs accredited only by the AOA participated in an extended and unstructured filling process after the match known as the “scramble”; but because these programs were unable to accept unmatched international medical graduates or allopathic students, they did not always fill by the start of the residency training year. Under AOA accreditation, however, they were able to increase positions offered in the following year’s match. Positions offered and filled by any individual program, therefore, could vary substantially from year to year.
Workplace environment and geography historically have been identified as the most important influences on students’ choice of residency programs. 10 From 1998 to 2001, a study of self-identified rural training track residencies (RTTs) demonstrated lower match rates than other family medicine programs, and distance from a nearby “desirable” place to live explained most of the difference. 11 Over more than 30 years, declining numbers of matriculating medical students with rural background or rural practice intent 12 have added to the difficulties in recruiting students to rural programs.
Researchers have identified additional recruitment barriers at annual meetings of the Rural Medical Educators of the National Rural Health Association. 13 These barriers include students’ lack of rural experience in medical school, rootedness in urban living, connection to a significant other with an urban background or job, negative perceptions of rural living and practice, and limited knowledge about rural residency training. A perception that programs that do not fill in the match are of lesser quality may add to these recruiting difficulties. 14 Accrediting agencies, prospective students, and faculty advisors may conflate program excellence with publicly available NRMP match rates. Lacking other publicly available measures, students may use initial match rates as a proxy for quality and value. Studies over more than 20 years have questioned this assumption for both rural and urban residency programs. 15
Contrary to perceptions, rural programs with low match rates may simply have insufficient numbers of qualified applicants interested in that region that year, may have limited program visibility, and/or may have been overly selective. Given profound rural shortages of primary care physicians, as highlighted during the COVID-19 pandemic, the need to provide applicants, accrediting bodies, and policy makers with relevant measures of program quality and avoid use of invalid measures is important.
Although studies have explored relationships between initial match rate and various measures of program quality, none examined match rates in rural programs comprehensively or longitudinally. 14, 15 Previous studies on rural residency choice and the match have suffered from the lack of a widely accepted and consistent definition of a rural program or RTT and often have relied on program self-reporting and student surveys. 16
Using a published listing of all rural programs in the United States, 17 25 years of comprehensive NRMP data, and 11 years of AOA match data, this study (1) documents patterns in initial match rates for rural versus urban residency programs, (2) compares rural residency match rates with descriptive program characteristics for match years 2009-2013, (3) examines associations of match rates with program outcomes for graduates in years 2013-2015, and (4) through interviews of rural residency coordinators, explores successful rural recruitment strategies. This study provides a historical perspective essential to the mission of producing physicians for rural practice.
We used five data sources for this mixed-methods study: The RTT Collaborative (RTTC) historic listing of rural programs over more than 2 decades 17; NRMP match data; AOA match data; program-level outcomes data from the American Board of Family Medicine (ABFM); and interviews with residency coordinators (RCs) at select rural programs.
We categorized residency programs as rural starting with the RTTC listing for family medicine. 17 We defined rural programs more narrowly than the RTTC as only those whose primary family medicine practice location has a Rural-Urban Commuting Area (RUCA) 18 code of 4.0 or greater and where more than 50% of training occurs in a rural location by the same RUCA criterion. We defined RTTs (a subset of rural programs also known prior to 2021 as integrated rural training tracks, or IRTTs) as separately accredited rural programs with substantial training in urban settings but less than 50% (ie, range 3-15 months). 19 We defined all other programs as urban.
Match Trends
We examined trends in initial NRMP match rates of rural versus urban family medicine residency programs from 1996 through 2020 and AOA match rates from 2009 through 2019. Because the AOA match process differed significantly from the NRMP in timing, applicant pool (no allopathic or international graduates), and recruiting context, we analyzed the NRMP and AOA data sets separately and compared only general patterns. We calculated annual match rates for rural versus urban residency programs, graphing rates and the number of positions offered over 25 years for the NRMP and 11 years for the AOA.
Program Characteristics
To examine associations of match rates with program characteristics and to align with available ABFM data for measuring program outcomes, we evaluated a subset of NRMP match rates for 2009 through 2013 (averaged over the 5-year period for each program) to measure how rural versus urban programs with better and worse match rates compared by type of sponsoring institution, census region, two measures of community livability, years of participation in the match, and categories of 5-year average program size. We chose as measures of community livability the AARP Livability Index (AARP-LI), 20 a measure of attractiveness and living amenities; and the Area Deprivation Index (ADI), 21 a measure of community vulnerability and potential lack of attractiveness for living. We measured program size by positions offered in the match each year.
This analysis included 74 programs: the 37 rural programs participating in the NRMP match in any of these 5 years, and the 37 closest urban programs in driving miles (to mitigate intangible effects such as scope of training or proximate medical student supply, which vary by location other than census region). In bivariate analyses, we used analysis of variance and t tests to test for differences (at significance level P<.05) between match rates and program characteristics. We used linear regression to predict the effect of rural location and program size, type of sponsoring institution, census region, AARP-LI, ADI, and years of NRMP participation on match rates in the 2009 through 2013 data subset.
Program Quality
To explore the relationship between match rates and measures of program quality, we assessed program-level ABFM data for the 2010, 2011, and 2012 cohorts of matriculants through the time of their 3-year postgraduation National Graduate Survey (NGS) in 2016, 2017, and 2018. We then assessed these data in relation to program match rates averaged for the 5-year period encompassing these cohorts’ matriculation into and graduation from residency. The measures of quality we evaluated included slope of in-training exam (ITE) scores over 3 years of training (a measure of resident progress) and board certification exam scores and passage rates. Additional measures of quality derived from responses to the NGS 3 years postgraduation included placement in rural practice, the Individual Scope of Practice scale (I-SOP), 22 and an index created using the same method as the I-SOP, measuring graduate perceptions of preparedness in 25 areas of practice. 23 Because match rates clustered near 100%, we assessed associations between 2009 through 2013 match rates and program outcomes using Spearman’s rank correlation coefficients.
We used Stata Release 14.0 24 and SAS Version 9.4 25 for all quantitative analyses.
Recruitment Strategies
From June to September 2021, we interviewed RCs from rural residencies, recruiting programs from all US census regions to ensure geographic representation—half with match rates above the median and half below the median match rate of 81%. We sequentially invited two randomly selected RCs from each census region, sending up to two email invitations, followed by two phone calls to nonresponders. If an invitee declined or did not respond to the invitation within 2 weeks, we replaced the name with another RC from the same census region until we achieved a sample of 20, with at least 3 from each region.
Before the interview, RCs received a project description and human subjects research information, and completed a survey confirming numbers from the 2018, 2019, and 2020 match. The interviews were semi-structured using a guide with 15 open-ended questions, addressing recruiting techniques, participation in national and local conferences and residency fairs, the process for choosing applicants and creating rank lists, use of SOAP, recruitment challenges, and strategies for achieving match success. Each interview, lasting 45 to 60 minutes, was conducted on Zoom by at least two researchers, audio recorded, and transcribed. Three researchers engaged in iterative rounds of directed content analysis, 26 identifying key themes by independently reviewing interview data. Researchers then compared interpretations, reconciled discrepancies, and together reviewed and finalized themes.
The University of Washington Human Subjects Division approved this study as exempt research.
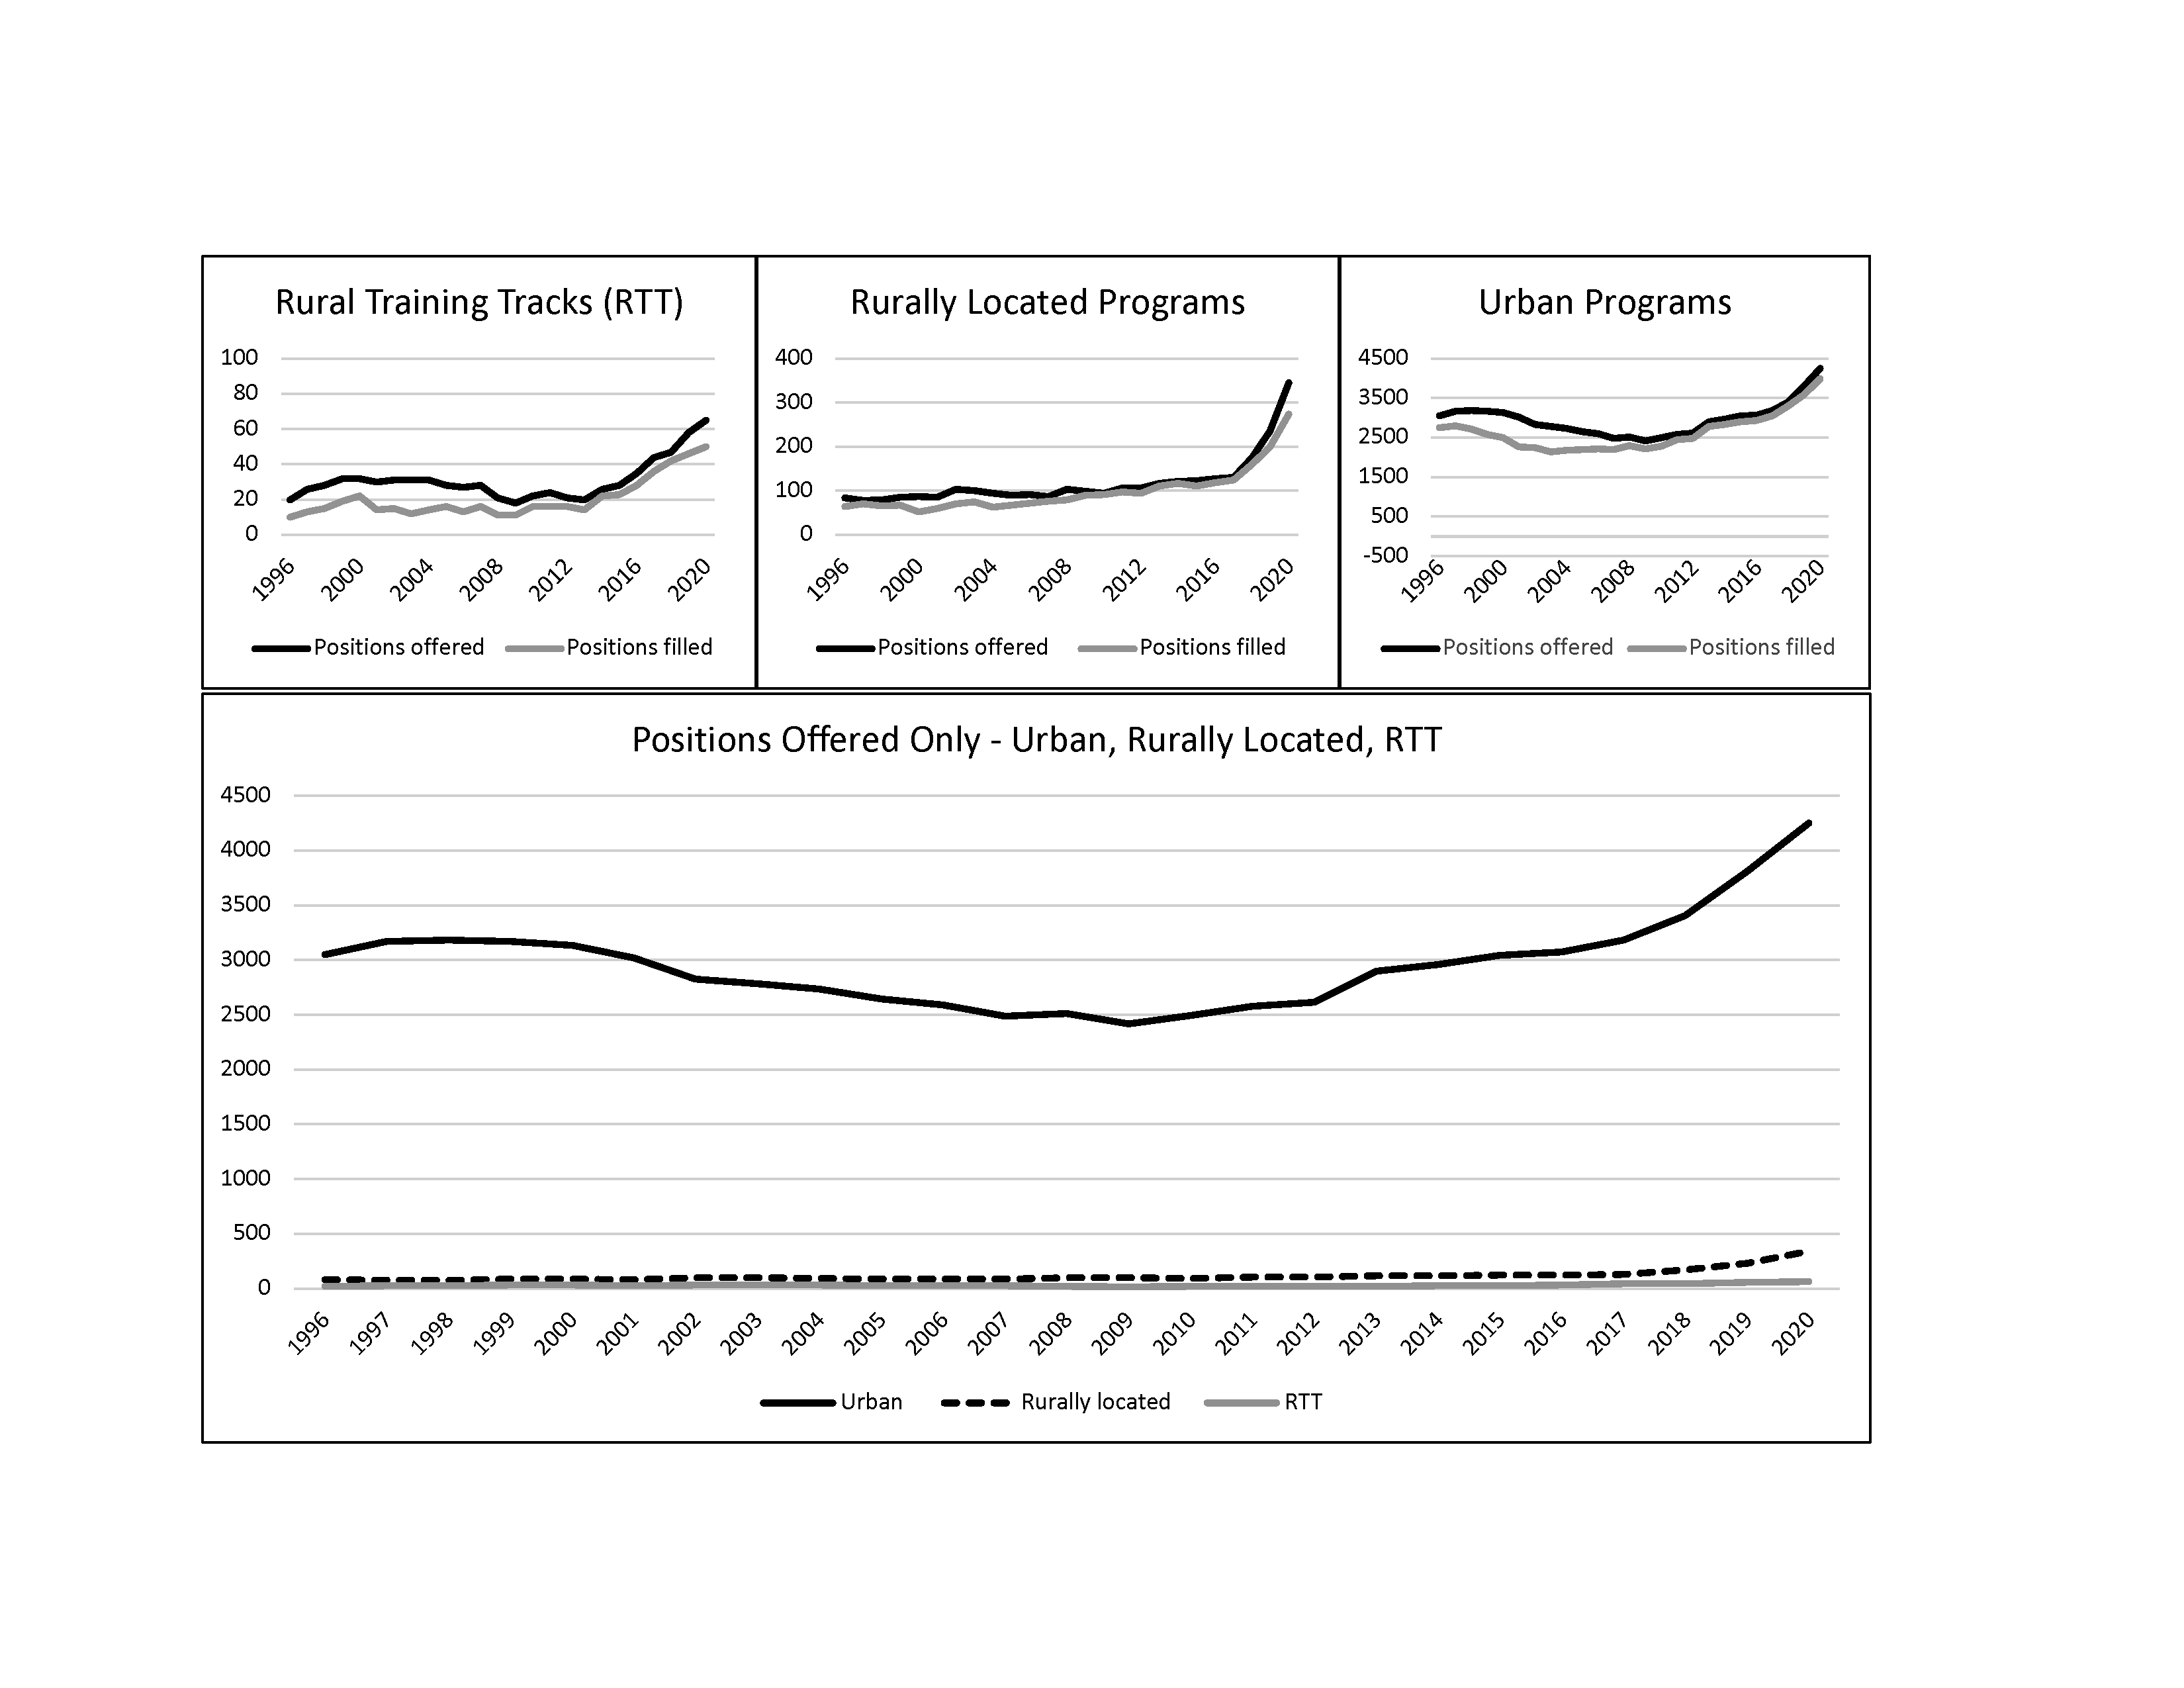
The number of rural residency programs and positions offered in the match increased substantially during the 25-year study period. In 1996, 13 RTTs offered 20 positions; and by 2020, 32 RTTs offered 65 positions (225%↑). Fourteen rurally located programs increased to 65, and positions offered increased from 84 to 345 (311%↑). Urban programs increased from 454 to 616, while positions offered increased from 3,053 to 4,252 (39%↑). The transition to a single accreditation system, which brought an influx of osteopathic programs into the NRMP match, accounted for much of this growth in the last 5 years of the study period. The percentage of rural positions offered in family medicine increased from 4.7% of all NRMP positions and 11.8% of all AOA positions in 2015 (5.8% of the combined total) to 9.6% of all NRMP positions offered in the single match in 2020.
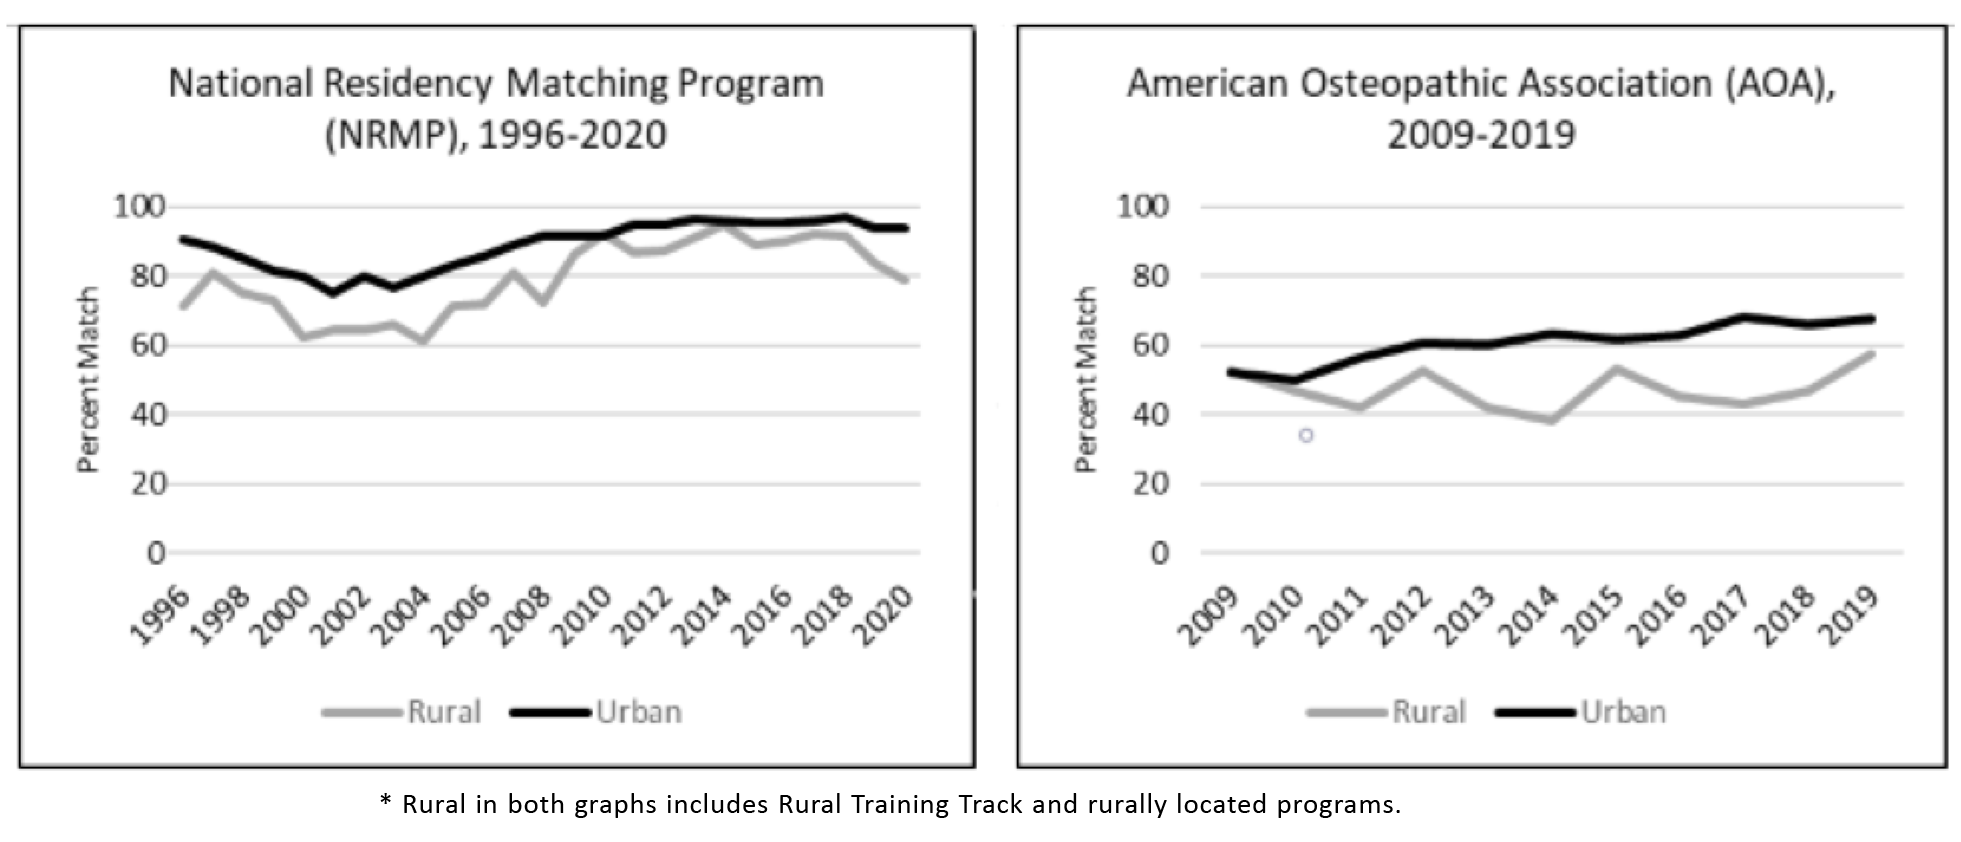
Figure 1 shows a similar growth pattern across all three types of programs (rurally located, RTT, and urban) even as the scale varies, while total positions offered, as plotted on a single scale, demonstrates the large gulf that still exists in the number of rural versus urban training positions. Despite the increase in positions offered over 25 years, the fill rates for both RTTs and rurally located programs generally have improved relative to urban programs (Figure 2). The osteopathic match followed a pattern similar to the NRMP from 2009 through 2019, although rural had not made the same gains on urban until the later years, during the transition to a single accreditation system.
The only significant predictor for initial NRMP match rate in a multivariate analysis of average match rates was a combined measure of program size and rural location, and only for the smallest of programs (Table 1); compared to all urban programs, small rural programs with two or fewer residents per year had significantly lower match rates. Type of sponsoring institution, census region, ADI, AARP-LI, and years of participation in the match were not significant.
|
Predictor by rural program size
|
Regression coefficient
|
P value
|
|
Urban programs
|
Ref
|
|
|
Rural, ≤ 2 residents
|
-0.27
|
<.001
|
|
Rural, 3 to 4 residents
|
-0.02
|
.77
|
|
Rural, > 4 residents
|
0.03
|
.68
|
Residency match rates were not significantly associated (P<.05) with any of the five measures of program quality (Table 2).
|
Program outcome *
|
Rural
|
Urban
|
Total
|
|
|
Correlation coefficients**
|
|
ITE slope
|
-0.04
|
-0.04
|
-0.04
|
|
ABFM board scores
|
-0.23
|
0.04
|
-0.09
|
|
Preparation index
|
0.01
|
-0.10
|
-0.03
|
|
Percentage of graduates in rural practice
|
-0.04
|
-0.18
|
-0.02
|
|
Scope of practice index
|
-0.26
|
-0.17
|
-0.14
|
The 20 residency coordinators were well distributed across US census regions, as a proportion of all rural programs in each region (χ2=1.69, P=.64), as follows: West (7 of 23 rural programs, 35.0% vs 23.7%), Northeast (3 of 11, 15.0% vs 11.4%), South (5 of 35, 25.0% vs 36.1%), and Midwest (5 of 28, 25.0% vs 28.9%). Twelve RCs noted that their program’s mission was to provide rural training. Table 3 displays key themes and subthemes regarding program recruitment strategies and tactics. Most programs (14) attended regional/state fairs and/or the American Academy of Family Physicians (AAFP) National Conference (13). RCs generally felt that participation in regional/state conferences more effectively “gets our name out there” among likely candidates and may be more productive than national recruiting venues. In-person interaction was an important feature for those that did attend conferences. Most established residencies offered medical student rotations and/or clerkships as a way for students to get acquainted with their program and vice versa.
|
Main themes
|
Subthemes
|
|
Programs’ approaches to applicant selection
|
· Reliance on filters and rubrics vs review of all applications
· Emphasis on applicant’s commitment to family practice, interest in rural medicine, experience with underserved communities, likelihood of staying in the community, alignment with the program’s mission
|
|
Highlighting benefits of rural residency training
|
· Ability to tailor training to an individual’s interest, given the relatively small number of residents
· One-on-one attention and teaching from faculty
· Availability of broad-scope training
· Work-life balance
· Opportunities for rural outdoor activities
· Benefits of small-town living, including safety, cost of living, ability to raise free-range kids
· The close-knit, family-like atmosphere of many rural programs
|
|
Recruitment challenges in rural residencies
|
· Competition with urban and other rural programs
· Finding “good fits” among applicants more familiar with urban life
· Cost of applicant travel during selection process
· Less diversity in the community compared to urban areas
· The need for residents in RTTs to move from the urban residency location to the rural community after the first year of training (for programs in the 1-2 format)
|
|
Range of RC roles in recruitment
|
· Sorting and preparing applications for review
· Coordinating applicants’ site visits
· Personally screening and selecting applicants for interviews
· Developing and finalizing the rank list
|
|
Measures of success in recruitment
|
· Filling during the match
· Resident satisfaction and graduates who have met their own goals
· Program fit in meeting the individual’s and program’s priorities
· Matching with residents with an interest in rural medicine
· Resident retention in the community after graduation
· Teams that work well together
· Graduates who are positive representatives of the program
|
|
Tips for recruiting to rural residencies
|
· Introduce applicants to the community through collaboration with non-health care community members
· Teach medical students through rotations, longitudinal integrated clerkships, or (for larger rural programs) a regional rural campus
· Emphasize scope of training tailored to the individual.
· For RTTs, incorporate urban colleagues in the interview process, if possible
· Relationships matter—within the program among residents, faculty, and staff; and with current or future applicants
· Be true to who you are—play to your strengths
|
The role of RCs in recruitment varied across programs and ranged from focusing solely on logistics to personally selecting applicants for interviews, even constructing the rank list with the program director. Recruitment at some programs was primarily driven by the RC. At others, it was program director-driven, while yet others used an all-hands-on-deck approach.
Although we heard tips pertinent to recruitment in any location, RCs deemed integrity and personal relationships as particularly important to rural community programs. One coordinator said, “Be yourself and highlight what’s best about your program. If you have the best hot wings or ice cream, just say that; whatever makes you as a person want to stay in the community, say that!” Emphasizing people and relationships more than program, most rural residencies attributed a successful match to the faculty, residents, and staff, and to their family culture and teamwork. Effort alone was not sufficient. When asked about the reasons for their program’s success, one coordinator described incredible personal effort and hospitality; and then, in rural self-deprecating fashion, said, “I have no idea!”
Rural family medicine residency programs and positions have grown significantly over the past 25 years. Yet, rural positions in 2020 were still underrepresented compared with the rural proportion of the US population (19.3% in the 2010 census; 2020 Census Bureau rural analysis anticipated in 2023). 27 Match rates for rural programs have improved significantly relative to urban. In the context of increasing rural program numbers and positions, this finding suggests increased visibility and heightened interest among prospective applicants. These trends may be due to sustained efforts from The RTT Collaborative, which emerged from the federally funded RTT Technical Assistance Program (2010-2016); the influx of rural-interested students from osteopathic medical schools; or increasing student interest in rural training for other reasons.
Very small rural programs had lower match rates, but no other program or community characteristics examined were predictors of initial match success. Contrary to prior studies, neither community deprivation nor livability predicted match rates—potentially good news for those who worry about community deficits and desirability. Most importantly, in addressing a perception conflating match rates with quality, match rates were not indicative of any of five measures of program quality or value.
Interviews with rural RCs revealed numerous strategies and activities common to residency programs of all types. RCs shared important wisdom particularly relevant to rural recruiting, but we did not discover a “secret sauce’” or shortcut to match success.
This study’s strengths include its comprehensive examination of all rural family medicine programs, inclusion of both ACGME and AOA historic data, 25-year scope, and reliance on objective measures of rurality and quality rather than self-report. Our study, though, had imitations. Quantitative studies of small rural programs are limited in their generalizability, given the challenges of small numbers, variety of rural program contexts, and variability in program resources. Information on RTTs closing before 2000, when the ACGME started publicly listing and indexing program closures, and other rural programs closing before 2016 is not available. We may have missed one or two RTTs prior to 2000, when they were first tracked by the lead author and colleagues, as well as rural osteopathic programs that closed in the years 2009 through 2016. We may have misclassified as urban a few allopathic rural programs that closed prior to 2016, when The RTT Collaborative started tracking rural programs other than RTTs. A dearth of long-term patient and community-oriented measures of educational program effectiveness and quality exists. Intermediate measures, such as board scores and ITE scores, are imperfect measures of the best physicians. Interviews are subject to self-report bias; and although we achieved thematic saturation in our survey of residency coordinators, findings represent their perspectives and may not be generalizable to all rural residency programs. In addition, we were unable to assess sample representativeness by comparing responding and nonresponding programs.
Understanding the intricacies of rural residencies—from inputs to outcomes—is key to addressing rural workforce gaps. Initial match rates, rather than a measure of program quality, likely reflect the challenges of rural workforce recruitment generally. Improved rural match rates over time are particularly noteworthy and encouraging. Our findings will be of interest to medical students, family medicine educators, medical school advisors, and policy makers invested in ensuring that graduate medical education meets the needs of the public.
Acknowledgments
The authors wish to acknowledge and thank Mark Speicher, PhD, and colleagues from the AOA, particularly Maura Bizewski, for their assistance in obtaining AOA match data. We also wish to thank the residency coordinators who participated in interviews.
References
-
-
National Academies of Sciences, Engineering, and Medicine.
Graduate medical education outcomes and metrics: proceedings of a workshop. National Academies Press; 2018. Accessed June 2022.
https://doi.org/10.17226/25003
-
Kozakowski SM, Travis A, Marcinek JP, Bentley A, Fetter GT Jr. Results of the 2017 National Resident Matching Program and the American osteopathic association intern/resident registration program. Fam Med. 2017;49(9):679-685.
-
Skinner BD, Newton WP. A long-term perspective on family practice residency match success: 1984-1998. Fam Med. 1999;31(8):559-565.
-
Phillips JP, Wendling A, Bentley A, Marsee R, Morley CP. Trends in US medical school contributions to the family physician workforce: 2018 update from the American Academy of Family Physicians.
Fam Med. 2019;51(3):241-250.
doi: 10.22454/FamMed.2019.395617
-
-
-
-
Almarzooq ZI, Lillemoe HA, White-Manigault E, Wickham T, Curtin LS. The single match: reflections on the National Resident Matching Program’s sustained partnership with learners.
Acad Med. 2021;96(8):1,116-1,119.
doi: 10.1097/ACM.0000000000004138
-
Nuthalapaty FS, Jackson JR, Owen J. The influence of quality-of-life, academic, and workplace factors on residency program selection.
Acad Med. 2004;79(5):417-425.
doi: 10.1097/00001888-200405000-00010
-
Malaty W, Pathman DE. Factors affecting the match rate of rural training tracks in family practice. Fam Med. 2002;34(4):258-261.
-
Shipman SA, Wendling A, Jones KC, Kovar-Gough I, Orlowski JM, Phillips J. The decline in rural medical students: A growing gap in geographic diversity threatens the rural physician workforce.
Health Aff (Millwood). 2019;38(12):2,011-2,018.
doi: 10.1377/hlthaff.2019.00924
-
-
Porter M, Malaty J, Rubin D, et al. Seeking quality and attracting candidates: residency program directors’ perceptions. Educ Res Appl. 2017;2017(8):1-6.
-
Mims LD, Mainous AG III, Chirina S, Carek PJ. Do ABFM board pass rates or additional curriculum activities affect match rates for family medicine residency programs? Fam Med. 2014;46(4):276-281.
-
Rosenblatt RA, Hagopian A, Andrilla CH, Hart G Jr. Will rural family medicine residency training survive? Fam Med. 2006;38(10):706-711.
-
-
-
-
-
-
O’Neill T, Peabody MR, Blackburn BE, Peterson LE. Creating the Individual Scope of Practice (I-SOP) scale. J Appl Meas. 2014;15(3):227-239.
-
-
Stata Statistical Software. Release 14. StataCorp; 2015.
-
SAS Statistical Software. Version 9.4. SAS Institute; 2013.
-
Assarroudi A, Heshmati Nabavi F, Armat MR, Ebadi A, Vaismoradi M. Directed qualitative content analysis: the description and elaboration of its underpinning methods and data analysis process.
J Res Nurs. 2018;23(1):42-55.
https://doi.org/10.1177/1744987117741667
-


There are no comments for this article.