Background and Objectives: Diversity, equity, and inclusion (DEI) efforts strive to create a physician workforce that represents the general population. Barriers remain, however, regarding the promotion of women and underrepresented in medicine (URiM) physicians. We sought to describe gender and race trends in academic family medicine leadership over the past decade.
Methods: We performed a secondary analysis of Council of Academic Family Medicine Educational Research Alliance clearinghouse data, examining demographic survey responses from available surveys of family medicine clerkship directors (CDs), program directors (PDs), and department chairs from 2011 to 2023.
Results: During the time studied, family medicine CDs female representation expanded to 60.2% of CDs, an increase of 23%. CDs increased Asian representation by 127% without significant change in other racial groups. Family medicine PDs female representation expanded to 54.5% of PDs, an increase of 97%. PD Black representation expanded by 51%, and Asian representation expanded by 100%. Family medicine department chairs female representation expanded to 37.5% of chairs, an increase of 61%. Similarly, Black representation expanded by 95%, and Hispanic representation expanded by 150%. In total, 19.1% of chairs identified as URiM in 2023.
Conclusions: Family medicine has improved advancements into academic leadership positions. Family medicine CDs and PDs have achieved representative status of females but lag in URiM representation. Family medicine department chairs have made progress in both female and URiM representation but still lag compared to the general and family medicine physician population. Additional mentorship and sponsorship are needed to access the resources available in family medicine to further advance DEI in the representativeness of its leadership.
The primary care physician workforce in the United States does not proportionally reflect the gender or racial and ethnic diversity of the United States.1 US census data from 2020 shows that 51.1% of the general population is female, while Black, Hispanic, and Indigenous populations represent 35% of the general population. 2 Improving the gender and racial/ethnic diversity of the family medicine workforce is a key recommendation by multiple family medicine associations. 3 Along with improving the diversity of family medicine, promoting those of diverse backgrounds into leadership is imperative. Diverse leadership may contribute to equitable health care systems that serve the needs of all. 4
One measure of diversity is underrepresented in medicine (URiM). URiM is partially a result of historically rooted systemic inequities hindering advancement into physician careers. A recent focus to improve URiM representation in leadership has resulted in several programs to enhance skills and address the unique needs that URiM faculty might require. 5-8
Women are underrepresented in leadership positions in academic medicine in multiple specialties, 9 despite women now encompassing most of the medical school graduates, increasing the proportion of women in medicine. 10, 11 Gender stereotypes and double standards regarding leadership style also play a role in promotion disparities. 12
While limited, the published data on racial/ethnic diversity within department chairs in family medicine do show progress in improving representativeness.13, 14 Family medicine, as a specialty, has the highest percentage of URiM department chairs, but representation is still lagging compared to the United States population. 13, 14 Similarly, neither the family medicine trainee workforce (medical students 27.2% URiM, family medicine residents 23.3% URiM) 10, 15, 16, academic family medicine faculty (21.9% URiM), 17, 18 nor family medicine PDs (11.5% URiM) 19 currently match the racial/ethnic demographics of the United States. No published data are available on the diversity of family medicine clerkship directors.
Previous published studies all have been cross-sectional designs providing snapshots of the diversity of the academic family medicine workforce. To define progress in achieving representative leadership in academic family medicine, we must first understand the most recent demographic trends. This study aimed to explore racial/ethnic and gender demographic trends of academic family medicine leadership, specifically family medicine clerkship directors, program directors, and department chairs, over the past decade.
We obtained data from the publicly available Council of Academic Family Medicine Educational Research Alliance (CERA) data clearinghouse. 20 CERA conducts annual cross-sectional surveys of all US family medicine clerkship directors and department chairs, as well as biannual cross-sectional surveys of all US family medicine residency program directors. 21-23 These surveys begin with standardized questions regarding the demographic data of the respondents. Methodology papers have validated the representativeness of CERA survey respondents and have found no differences between respondents and nonrespondents. 21-23 In these surveys, all US family medicine clerkship directors, program directors, and department chairs receive an email invitation to participate. The data are publicly available 90 days after each survey closes on the Society of Teachers of Family Medicine (STFM) website. These surveys were approved by the American Academy of Family Physicians (AAFP) Institutional Review Board prior to their administration.
Demographic data in each survey were abstracted for trendline analysis from 2011 to 2023. Program director surveys with multiple surveys within the same year were combined into singular data points. Gender and race/ethnicity were plotted over time. Data were compiled to represent academic family medicine leaders that are URiM based on the Association of American Medical Colleges (AAMC) definition: “Underrepresented in medicine means those racial and ethnic populations that are underrepresented in the medical profession relative to their numbers in the general population.” 24 This definition includes Black, Hispanic, Indigenous, and specific Asian nationalities (Vietnamese, Laotian, Cambodian, and Indonesian heritage). CERA surveys do not delineate Asian subpopulations. Because a large majority (>95%) of Asian physicians do not classify as URiM, we did not include them as URiM in our analysis. We also combined gender and race to assess the effects of intersectionality. We used descriptive statistics to describe trends in the data. We analyzed the data using R statistics software version 4.2.2 (R Foundation). We performed trendline analysis using linear logistic regression and Pearson’s correlation coefficient test.
Family Medicine Clerkship Directors
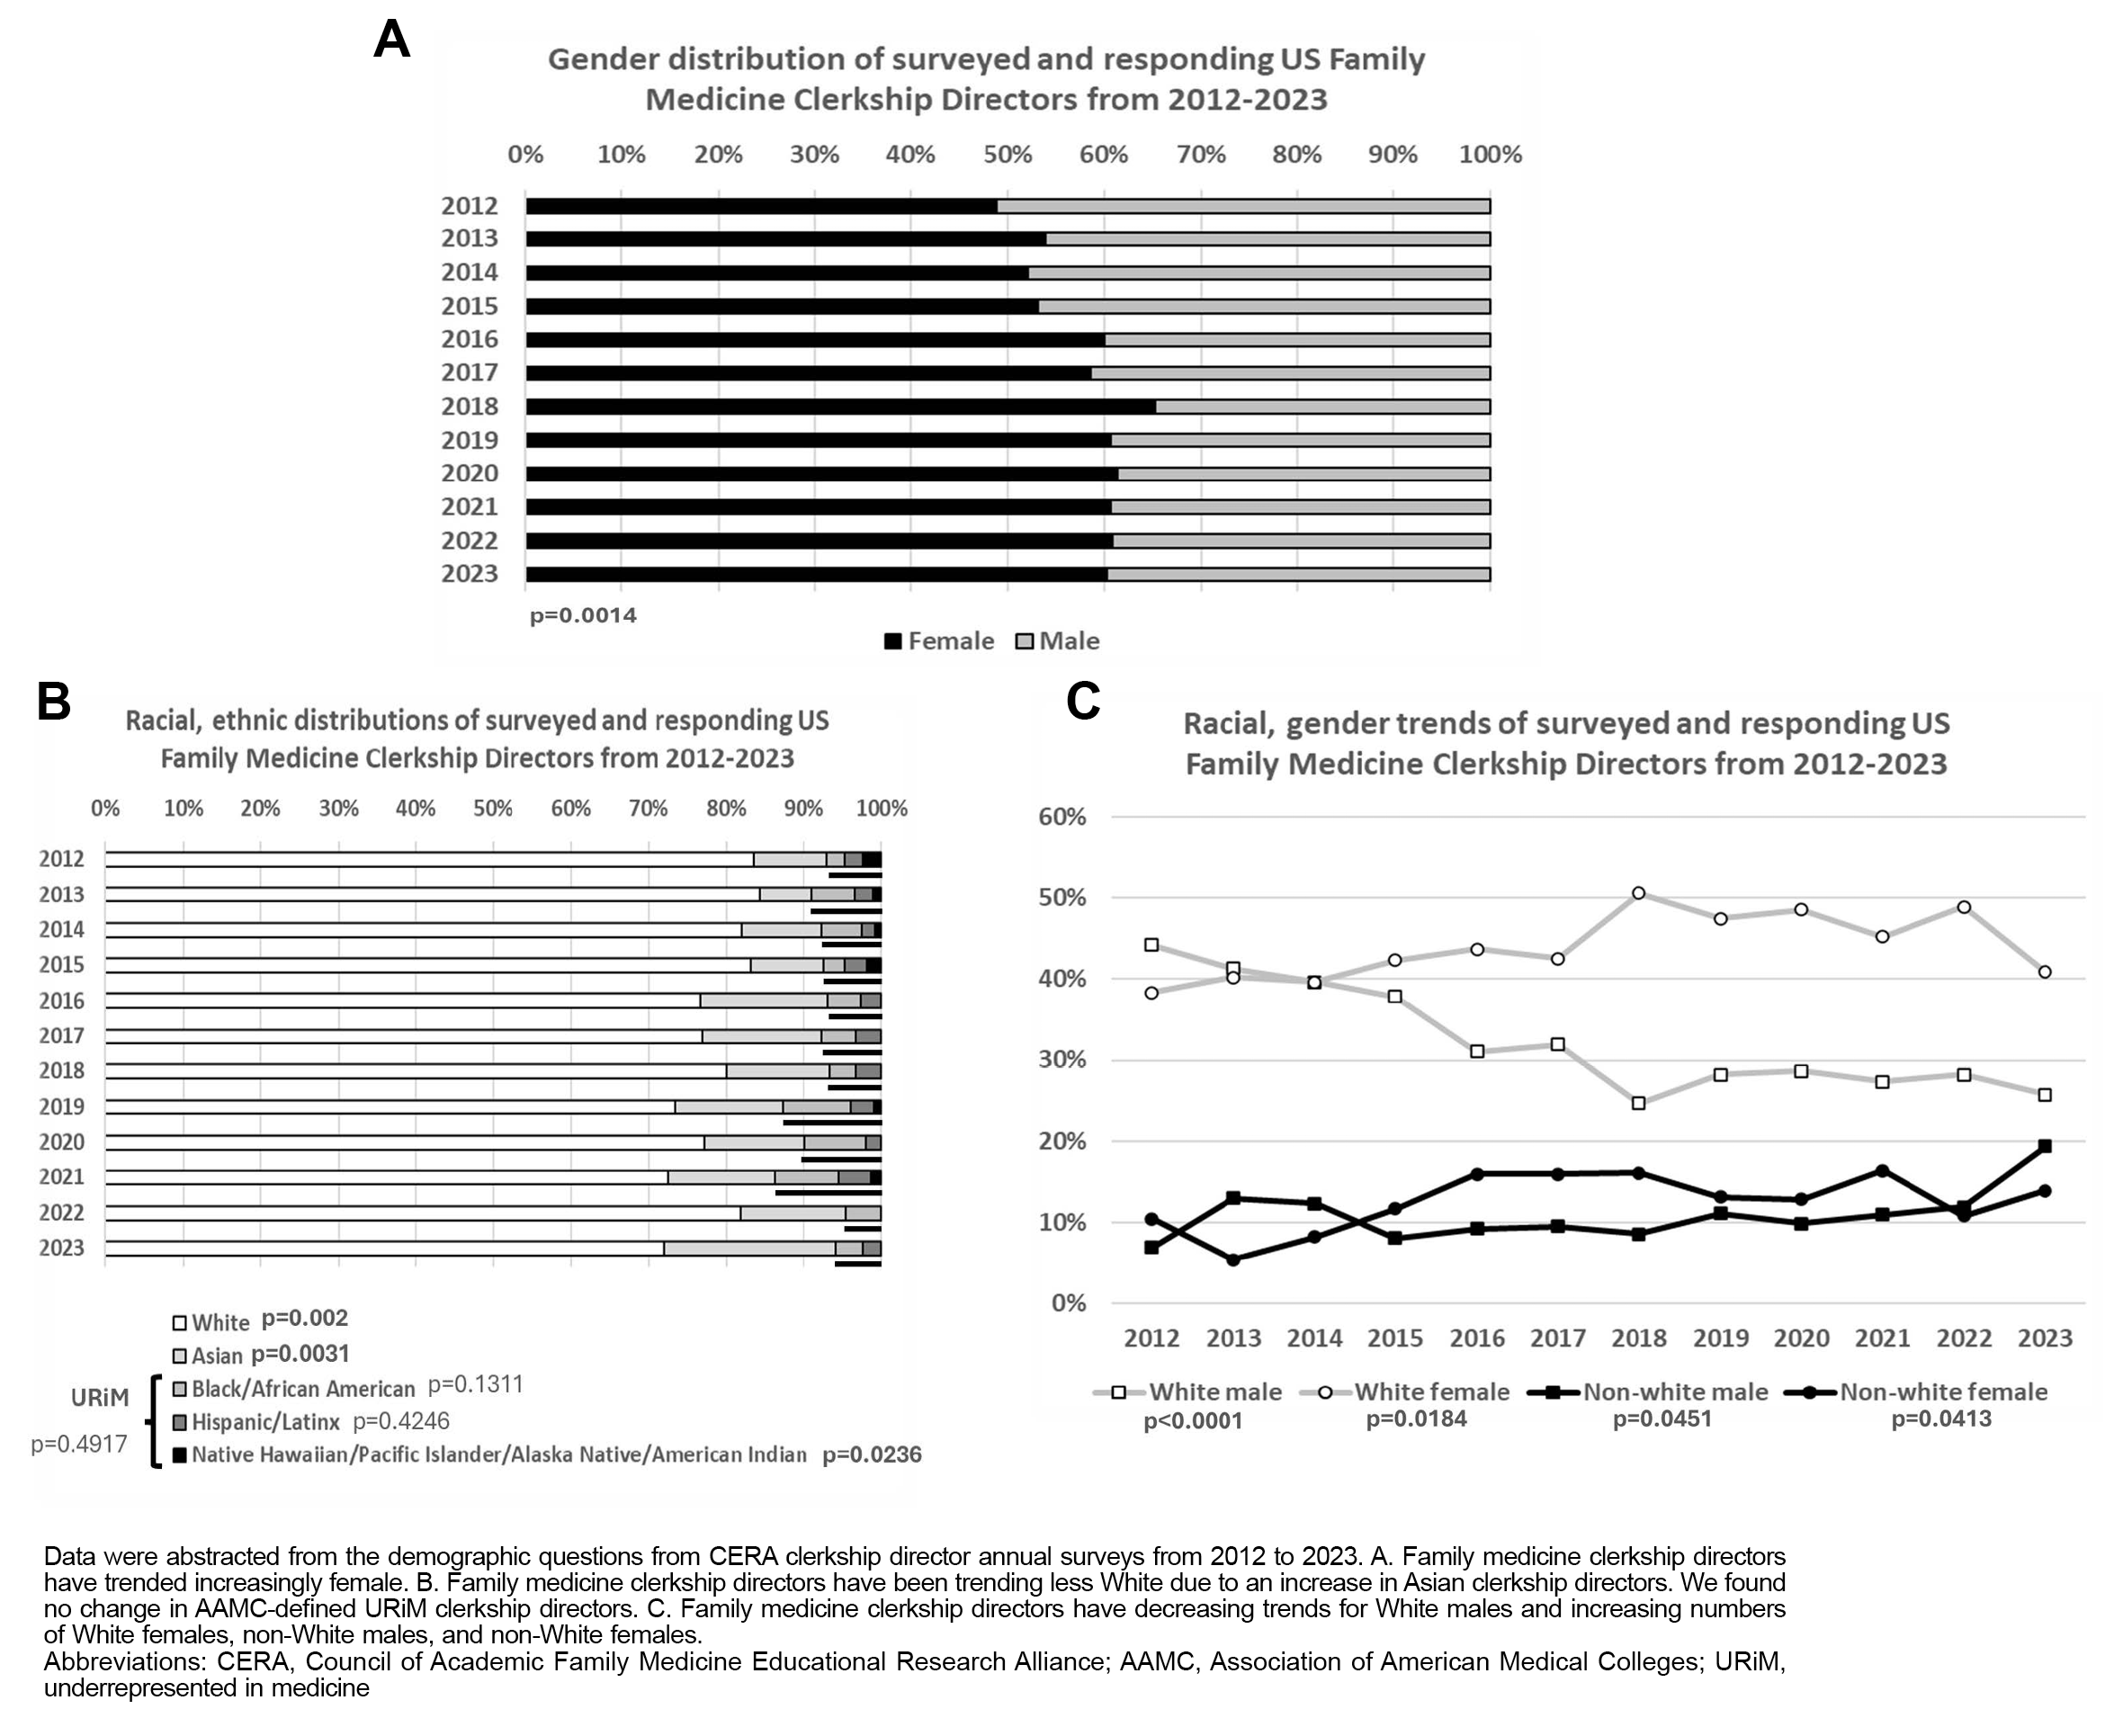
We analyzed a total of 12 CERA family medicine clerkship director surveys. All surveys included demographic information regarding respondents’ declared gender and race/ethnicity. Response rates for the CERA clerkship director surveys ranged from 49% to 86% (Appendix 1). We found no consistent changes in responding family medicine clerkship directors from public versus private medical schools during this time (ranges: 64.5%–72.7% and 27.3%–35.5% respectively). In the first survey, from 2012, 48.8% (42/86) of the survey’s respondents were female, and 51.2% (44/86) were male (Figure 1A). The racial/ethnic breakdown of these respondents was 9.4% (8/85) Asian, 2.4% (2/85) Black, 2.4% (2/85) Native Hawaiian/Pacific Islander/American Indian, 2.4% (2/85) Hispanic, and 83.5% (71/85) White (Figure 1B). Intersecting gender and race/ethnicity showed a population of 44.2% (38/86) White male, 38.4% (33/86) White female, 10.5% (9/86) non-White male, and 7.0% (6/86) non-White female (Figure 1C).
The 2023 CERA clerkship director survey showed that survey-responding US family medicine clerkship directors have become proportionally more female, increasing by 23% to represent 60.2% (56/93) of respondents identifying as female and 39.8% (37/93) as male (R
2=0.6075, P=.0014). During this period, the racial profile of survey-responding US family medicine clerkship directors has trended non-White. We found an 84% increase (30.3% vs 16.5%, R
2=0.5789, P=.002) in the proportion identifying as non-White and a 127% increase in the proportion identifying as Asian (21.3% vs 9.4%, R
2=0.543, P=.0031). The total racial/ethnic breakdown in 2023 was 21.3% (19/89) Asian, 3.4% (3/89) Black, 0% (0/89) Native Hawaiian/Pacific Islander/American Indian, 2.2% (2/89) Hispanic, and 69.7% (62/89) White. When grouping based on the AAMC URiM definition, URiM clerkship directors did not change over the past decade (9.0% vs 7.1%, R
2=0.0045, P=.4917). Intersecting race and gender data corresponded to a 7% increase in White females (40.9% vs 38.4%, R
2=0.367, P=.0184), an 85% increase in non-White males (19.4% vs 10.5%, R
2=0.2601, P=.0451), a 100% increase in non-White females (14.0% vs 7.0%, R
2=0.271, P=.0413), and a 42% decrease in White males (25.8% vs 44.2%, R
2=0.7974, P<.0001).
Family Medicine Program Directors
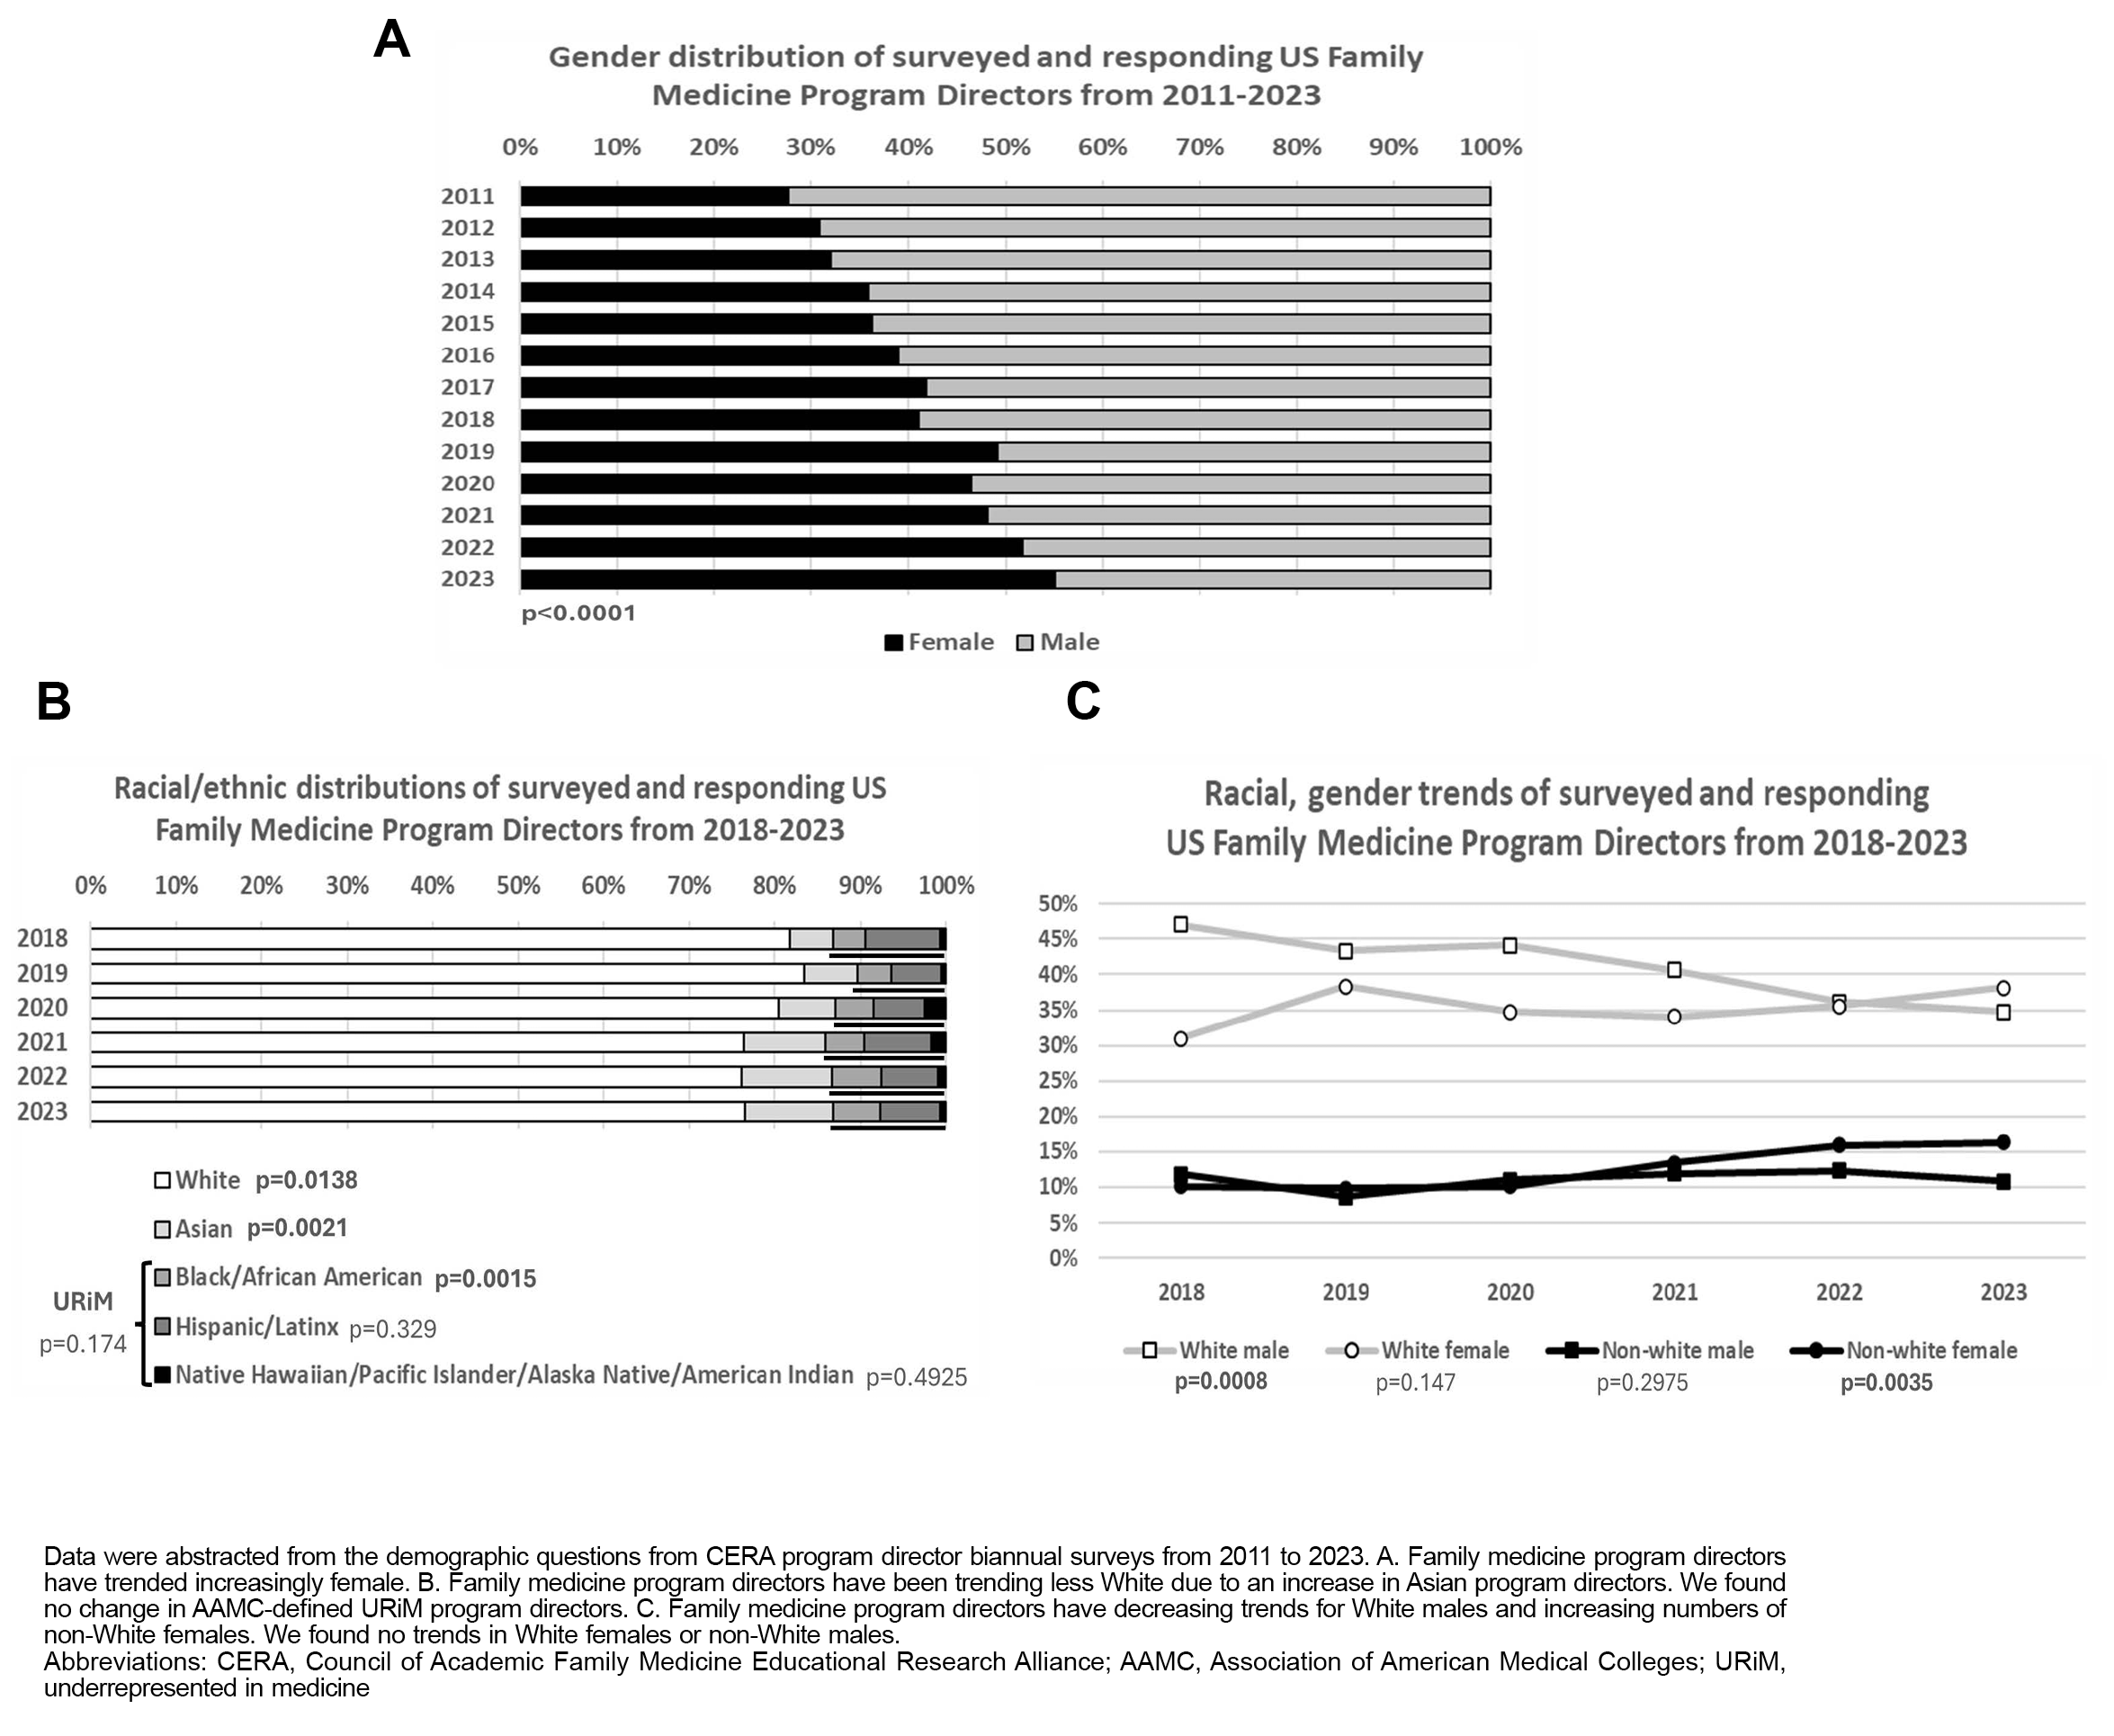
We analyzed a total of 22 CERA family medicine program director surveys. All surveys included demographic information regarding respondents’ declared gender, and 11 surveys included information regarding race/ethnicity. Response rates for the CERA program director surveys ranged from 41% to 61% (Appendix 1). We found no consistent changes in responding family medicine program directors from university-based programs, community-based programs, or military programs (ranges: 13.5%–19.6%; 75.6%–82.9%; 0.3%–5.0% respectively) or community size (ranges: <150,000 people 40.4%–52.1% and >150,000 people 47.9%–59.6%). The first survey was from 2011, where 27.6% (47/170) of that survey’s respondents were female and 72.4% (123/170) were male (Figure 2A). The first survey with racial/ethnic data was from 2017; it reported 4.9% (14/287) Asian, 3.5% (10/287) Black, 0.6% (1/287) Native Hawaiian/Pacific Islander/American Indian, 8.4% (24/287) Hispanic, and 78.0% (224/287) White (Figure 2B). Intersecting gender and race/ethnicity showed a population of 47.0% (135/287) White male, 31.0% (89/287) White female, 11.8% (34/287) non-White male, and 10.1% (29/287) non-White female (Figure 2C).
The 2023 CERA program director survey showed that survey-responding US family medicine program directors have become proportionally more female, with a 97% increase correlating with 54.5% (307/557) of respondents identifying as female and 45.5% (250/557) as male (54.5% vs 27.6%, R 2=0.9691, P<.0001). During this period, the racial profile of survey-responding US family medicine residency program directors has remained relatively unchanged, with a racial/ethnic breakdown of 9.8% (55/564) Asian, 5.3% (30/564) Black, 0.7% (4/564) Native Hawaiian/Pacific Islander/American Indian, 6.6% (37/564) Hispanic, and 72.9% (411/564) White. We observed statistically significant trends in a 23% decrease in White (72.9% vs 78.0%, R 2=0.7418, P=.0138), a 100% increase in Asian (9.8% vs 4.9%, R 2=0.8958, P=.0021), and a 51% increase in Black (5.3% vs 3.5%, R 2=0.9111, P=.0015) program directors. When grouping based on the AAMC URiM definition, URiM residency program directors did not change over the past decade (14.2% vs 12.5%, R 2=0.2201, P=.174). Combining race and gender data corresponded to a 50% increase in non-White females (15.2% vs 10.1%, R 2=0.8656, P=.0035) and a 25% decrease in White males (35.2% vs 47.0%, R 2=0.9351, P=.0008). We found no statistically significant change in White females (38.5% vs 31.0%, R 2=0.267, P=.147) and non-White males (11.1% vs 11.8%, R 2=0.0768, P=.2975).
Family Medicine Department Chairs
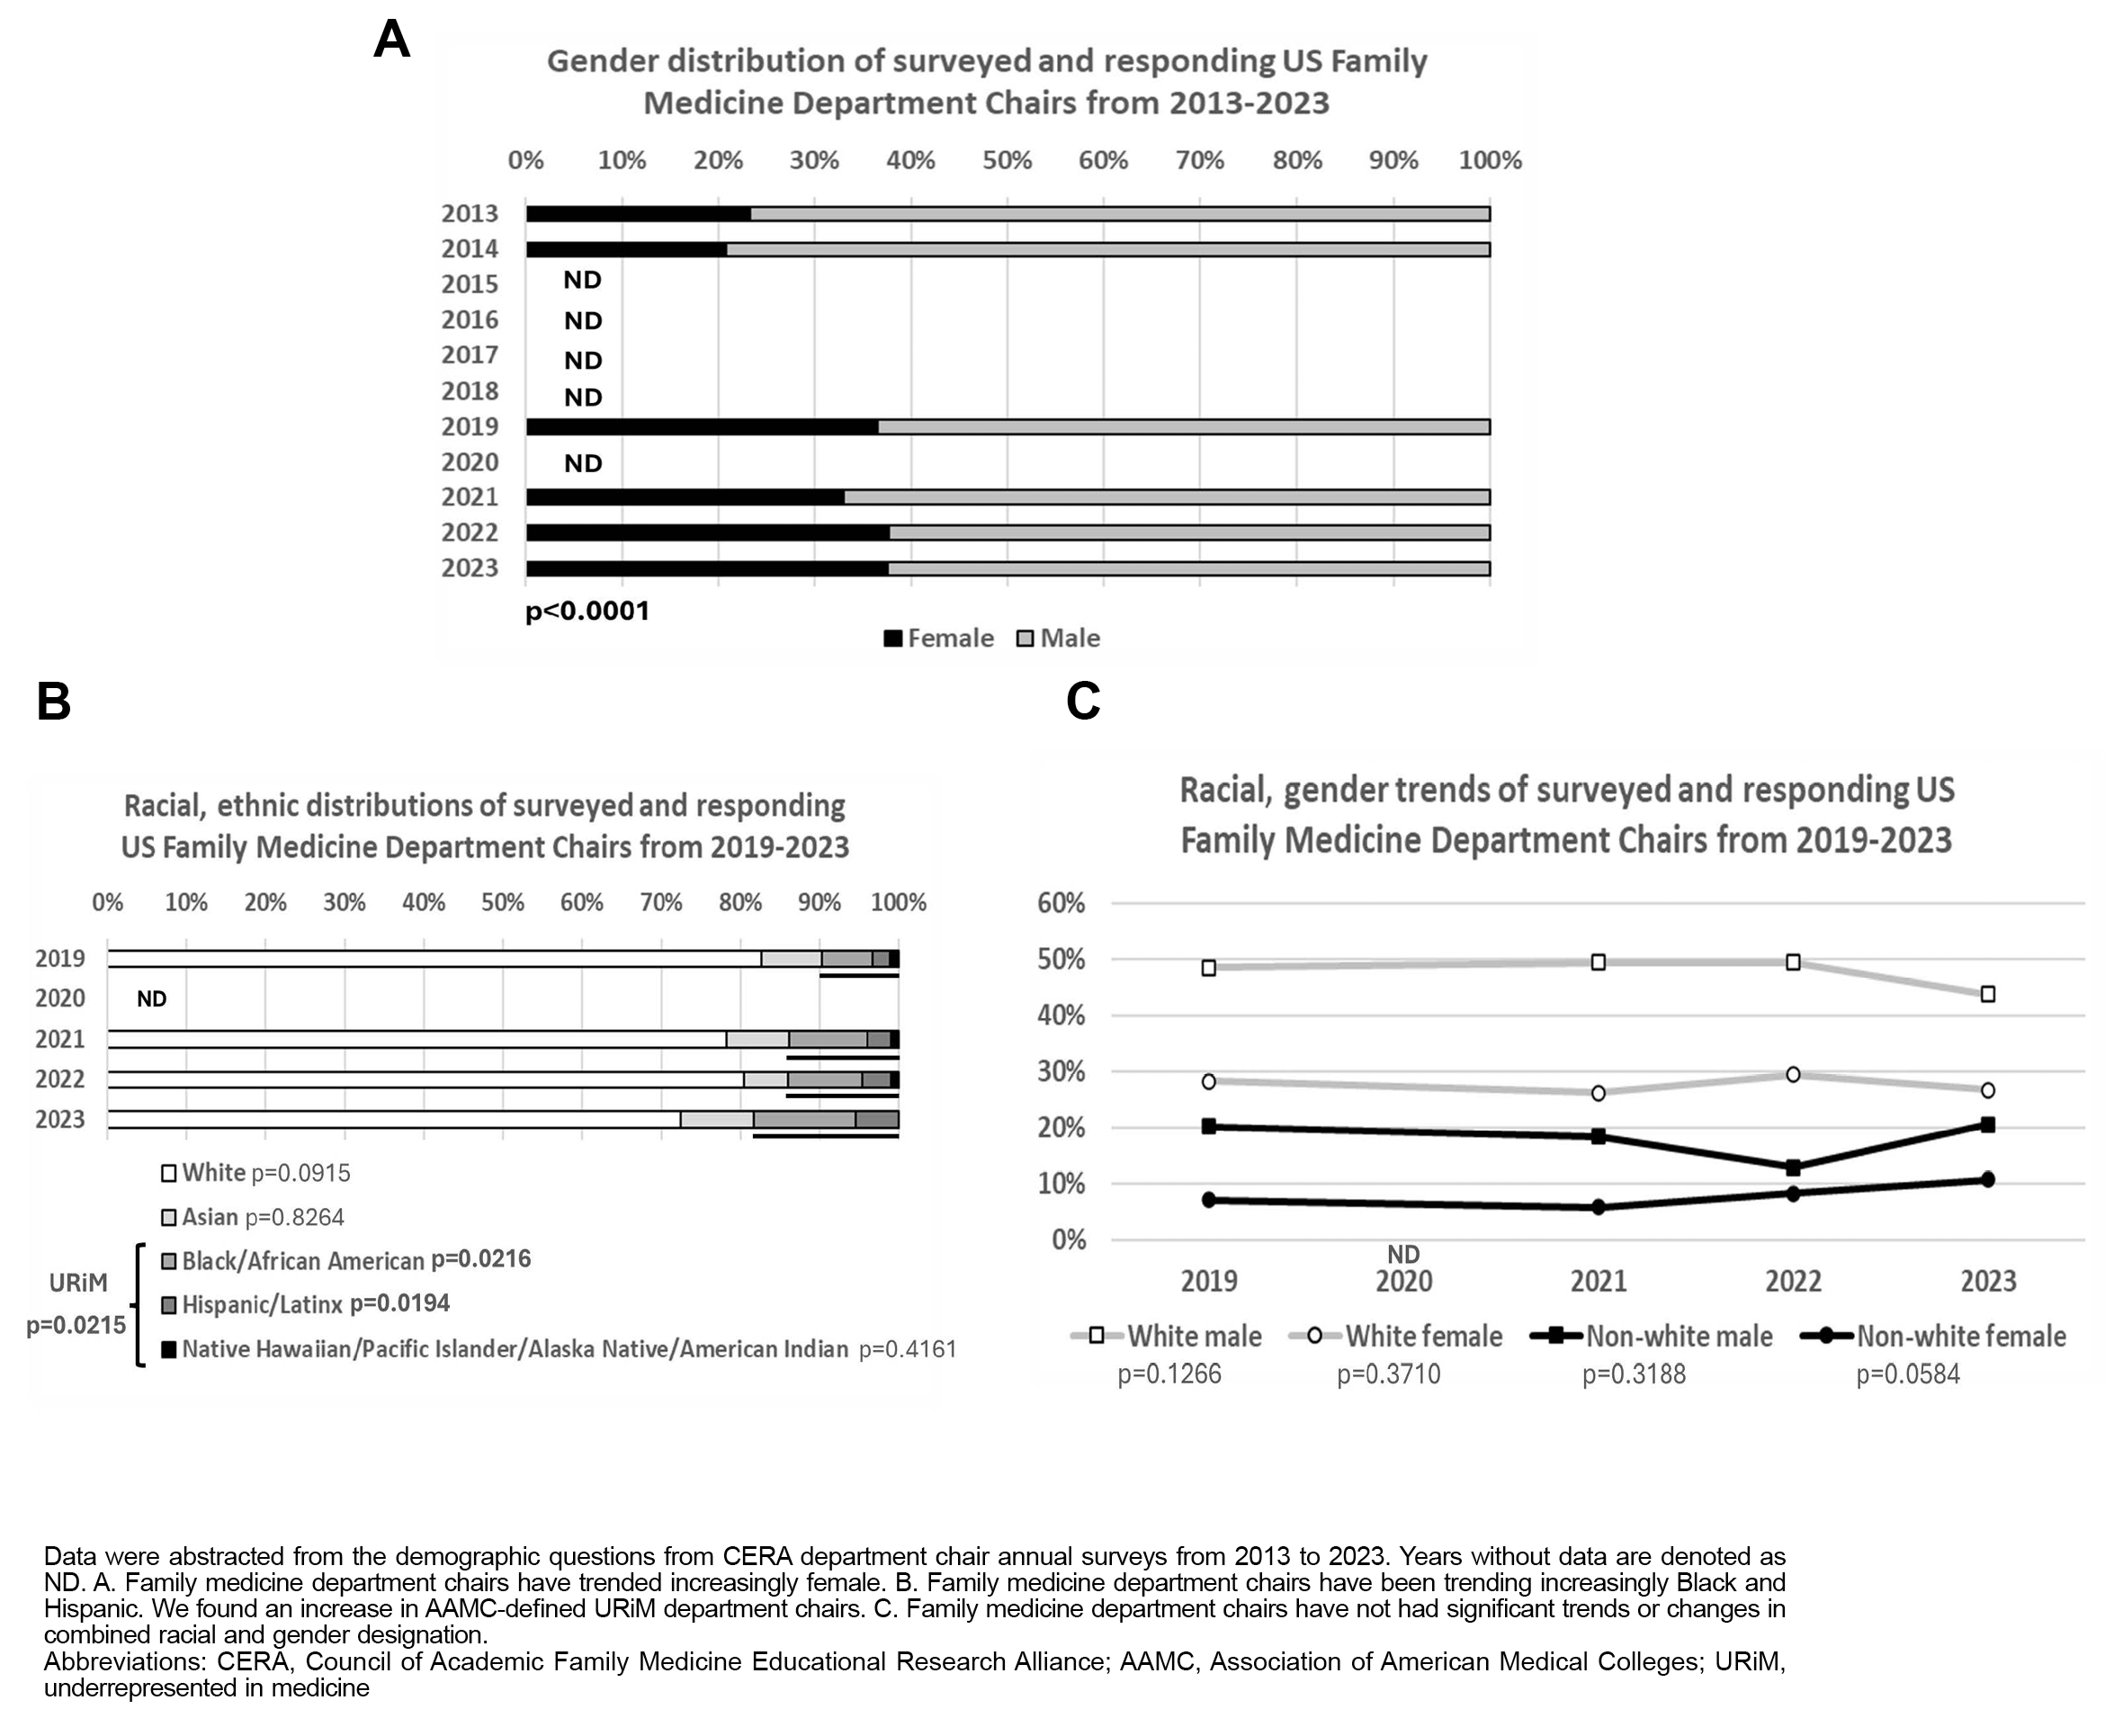
We analyzed a total of six CERA family medicine department chair surveys. All surveys included demographic information regarding respondents’ declared gender, and four surveys included race/ethnicity. Response rates for the CERA department chair surveys ranged from 48% to 77% (Appendix 1). We found no consistent changes in responding family medicine department chairs from university-based, community-based, or military departments (ranges: 53.5%–63.7%; 34.0%–43.9%; 0.3%–1.2%, respectively) or community size (ranges: <150,000 people 40.4%–52.1% and >150,000 people 47.9%–59.6%). In the first survey, from 2013, 23.3% (20/86) of that survey’s respondents were female, and 76.7% (66/86) were male (Figure 3A). The first survey with racial/ethnic breakdown was in 2019; it showed 7.1% (7/99) Asian, 6.1% (6/99) Black, 1.0% (1/99) Native Hawaiian/Pacific Islander/American Indian, 2.0% (2/99) Hispanic, and 76.8% (76/99) White (Figure 3B). Intersecting gender and race/ethnicity together showed a population of 50.5% (48/95) White male, 29.5% (29/95) White female, 21.1% (20/95) non-White male, and 7.4% (7/95) non-White female (Figure 3C).
The 2023 CERA department chair survey showed that survey-responding US family medicine department chairs have become proportionally more female, with a 61% increase to 37.5% (42/112) of respondents being female and 62.5% (70/112) being male (37.5% vs 23.3%, R
2=0.867, P<.0001). During this period, the racial profile of survey-responding US family medicine department chairs has had a 95% increase in identifying as Black (12.7% vs 6.5%, R
2=0.8666, P=.0216) and a 150% increase in identifying as Hispanic (5.5% vs 2.2%, R
2=0.8753, P=.0194). The remaining racial/ethnic breakdown in 2023 was 9.1% (10/112) Asian, 0.9% (1/112) Native Hawaiian/Pacific Islander/American Indian, and 71.8% (79/112) White. When grouping based on the AAMC URiM definition, URiM department chairs increased 95% over the past decade (19.1% vs 9.8%, R
2=0.8668, P=.0215). Race and gender data combined corresponded to no significant changes among White males (43.8% vs 48.5%, R
2=0.3077, P=.1266), White females (26.8% vs 28.3%, R
2=0.0302, P=0.3710), non-White males (20.5% vs 20.2%, R
2=0.0608, P=.3188), or non-White females (10.7% vs 7.1%, R
2=0.4968, P=.0584).
Representation and diversity in medicine matters, and the consequences of a lack of diversity, are detrimental to patients, medical students, residents, and colleagues. A diverse faculty can represent a more complete understanding of cultural awareness and increased cultural competency. These attributes affirm a greater understanding of cultural humility and health equity for students deciding which medical school or residency to attend.
Our study was consistent with other literature on cross-sectional analyses of family medicine department chair and program director demographics. 13, 14, 19 Our study was one of the first, though, to look at other academic leaders, such as clerkship directors, as well as the first to longitudinally assess progress in gender and racial/ethnic diversity.
The improvement in the number of female clerkship directors (60%) and program directors (54%) is representative of the academic family medicine faculty population, which is 56% female. Family medicine department chair female representation, although progressing, has not achieved representative status among the family medicine faculty population.
URiM leadership for family medicine department chairs (19%) is representative of the academic family medicine faculty population, which is 21.9% URiM, but not yet representative of the general population of the United States, which is 35% URiM. 1 Family medicine clerkship directors and program directors have seen an increase in those leaders identifying as Asian but have not seen an increase in the representation of URiM.
More studies need to be done to understand why academic family medicine leadership does not fully represent family medicine faculty physicians and the US general population. Accurately tracking the diversity of our leadership is a necessary first step, and publishing CERA surveys and organizational membership data (Association of Departments of Family Medicine [ADFM], Association of Family Medicine Residency Directors, AAMC, STFM, NAPCRG, AAFP) remain plausible options.19
For several years, inconsistent data were collected on race/ethnicity and gender. In our study, gender was assumed from the responses to the surveys, but past surveys did not include options beyond male and female. Later surveys have more inclusively classified gender by including cisgender and transgender options.25 Race and ethnicity in early surveys was not always included. More modern surveys include race options that are consistent with the US census definitions, including Asian, Native Hawaiian/Pacific Islander, Black, American Indian, Hispanic/Spanish, Middle Eastern, and White. 25 To accurately account for Asian subpopulations, CERA should consider deconstructing that ethnic population. Due to a paucity of data, we were unable to assess trends among transgender responses and Middle Eastern populations.
Lack of mentorship and sponsorship for women and URiM family medicine faculty is a root cause of inadequate representation within academic family medicine leadership. 26 Abundant programming and opportunities are available to help progress URiM family medicine faculty in their careers. The unspoken effects of systemic racial and gender biases add additional burdens to women and URiM faculty seeking leadership positions. 9, 27 Representation plays a role in building the diversity of future family medicine physicians; if future family medicine faculty are unable to see a leader who looks like them, they may not deem these positions as attainable. 28 As a specialty, family medicine has been a leader in improving its academic leaders’ representativeness, 16 but our analysis shows that work remains to be done. One cause for optimism is the Council of Academic Family Medicine’s creation of a leadership development task force, with a goal to increase the number of female and URiM leaders in family medicine. 3
Our data were limited by the family medicine departments who were surveyed and who completed the survey. The department chairs’ information included data only from university or medical school associated programs as part of ADFM and did not include data from independent academic medical centers that are not associated with a university or medical school. 21 The limitations of the sample population suggests an increase in gender diversity and less progress for diversity of race/ethnicity, though this speculation will need to be further explored using membership data; unfortunately, the current data infrastructure cannot accomplish this task longitudinally. Although membership data would be the gold standard, ADFM does not include department chairs of independent academic medical centers, and no current organization encompasses family medicine clerkship directors. Further elucidation regarding the generational differences and ages of physicians in these leadership roles is also desirable; we speculate that increases in gender and ethnic diversity are largely due to leadership positions held by younger physicians. Additionally, further studies should not only look at the recruitment of diverse faculty but also the development of diverse leaders into these positions. 29
Although family medicine as a specialty has many successes to celebrate regarding representativeness, family medicine departments need to continue to develop URiM and women faculty for leadership roles. Organizations should follow a process for filling leadership roles that is similar to the best practice recommendations used to recruit a diverse, representative resident physician workforce. 30 These practices include training interviewers in implicit bias mitigation, following inclusive selection processes, and continuing ongoing DEI committee work. 31 Family medicine departments must continue to role model the ongoing, dynamic commitment to DEI required to achieve representativeness at all leadership levels.
Acknowledgments
These data were collected as part of multiple surveys conducted by the Council of Academic Medicine Educational Research Alliance (CERA). These projects were approved by the American Academy of Family Physician’s Institutional Review Board.
Correction: This article was revised after publication on February 17, 2025 to correct a data error in the original publication, within the last sentence of the "Family Medicine Program Directors" results section, as follows:
"We found no statistically significant change in White females (38.5% vs 31.0%, R2=0.267, P=.147) and non-White males (11.1% vs 11.8%, R2=0.0768, P=0008)."
was corrected to:
"We found no statistically significant change in White females (38.5% vs 31.0%, R 2=0.267, P=.147) and non-White males (11.1% vs 11.8%, R 2=0.0768, P=.2975)."
References
-
Xierali IM, Nivet MA. The racial and ethnic composition and distribution of primary care physicians.
J Health Care Poor Underserved. 2018;29(1):556-570.
doi:10.1353/hpu.2018.0036
-
-
Weidner A, Elliott T, Franko J. From ADFM, AFMRD, NAPCRG, & STFM: CAFM sets goals for diversity of leaders & faculty.
Ann Fam Med. 2022;20(1):95-98.
doi:10.1370/afm.2784
-
-
-
Haynes J. AFMRD Diversity and Health Equity Task Force update.
Ann Fam Med. 2019;17(6):568-569.
doi:10.1370/afm.2482
-
-
-
Acosta DA, Lautenberger DM, Castillo-Page L, Skorton DJ. Achieving gender equity is our responsibility: leadership matters.
Acad Med. 2020;95(10):1,468-1,471.
doi:10.1097/ACM.0000000000003610
-
-
-
Spector ND, Asante PA, Marcelin JR, et al. Women in pediatrics: progress, barriers, and opportunities for equity, diversity, and inclusion.
Pediatrics. 2019;144(5):e20192149.
doi:10.1542/peds.2019-2149
-
Xierali IM, Nivet MA, Rayburn WF. Diversity of department chairs in family medicine at US medical schools.
J Am Board Fam Med. 2022;35(1):152-157.
doi:10.3122/jabfm.2022.01.210298
-
Adetoye M, Gold K. Race and gender disparities among leadership in academic family medicine. J Am Board Fam Med. 2022;35(5):902-905.
-
-
Xierali IM, Hughes LS, Nivet MA, Bazemore AW. Family medicine residents: increasingly diverse, but lagging behind underrepresented minority population trends. Am Fam Physician. 2014;90(2):80-81.
-
-
Xierali IM, Nivet MA, Gaglioti AH, Liaw WR, Bazemore AW. Increasing family medicine faculty diversity still lags population trends.
J Am Board Fam Med. 2017;30(1):100-103.
doi:10.3122/jabfm.2017.01.160211
-
Weidner A, Clements DS. CAFM leadership demographics.
Ann Fam Med. 2021;19(2):181-185.
doi:10.1370/afm.2678
-
Seehusen DA, Mainous AG III, Chessman AW. Creating a centralized infrastructure to facilitate medical education research.
Ann Fam Med. 2018;16(3):257-260.
doi:10.1370/afm.2228
-
-
-
-
-
-
Coe C, Piggott C, Davis A, et al. Leadership pathways in academic family medicine: focus on underrepresented minorities and women.
Fam Med. 2020;52(2):104-111.
doi:10.22454/FamMed.2020.545847
-
Edgoose JYC, Carvajal DN, Reavis KMP, Yogendran L, Echiverri AT, Rodriguez JE. Addressing and dismantling the legacy of race and racism in academic medicine: a socioecological framework.
J Am Board Fam Med. 2022;35(6):1,239-1,245.
doi:10.3122/jabfm.2022.220050R2
-
Calhoun A, Parker CB. The face of medicine is not my face…but, it should be.
J Racial Ethn Health Disparities. 2020;7(6):1,035-1,038.
doi:10.1007/s40615-020-00834-3
-
Ajayi AA, Rodriguez F, de Jesus Perez V. Prioritizing equity and diversity in academic medicine faculty recruitment and retention.
JAMA Health Forum. 2021;2(9):e212426.
doi:10.1001/jamahealthforum.2021.2426
-
Aibana O, Swails JL, Flores RJ, Love L. Bridging the gap: holistic review to increase diversity in graduate medical education.
Acad Med. 2019;94(8):1,137-1,141.
doi:10.1097/ACM.0000000000002779
-
Boatright D, London M, Soriano AJ, et al. Strategies and best practices to improve diversity, equity, and inclusion among US graduate medical education programs.
JAMA Netw Open. 2023;6(2):e2255110.
doi:10.1001/jamanetworkopen.2022.55110


There are no comments for this article.