Background and Objectives: Resident recruitment is one of the most important responsibilities of residency programs. Resource demands are among the principal reasons for calls for recruitment reform. The purpose of this study was to provide a national snapshot of estimated costs of recruitment among US family medicine programs. The aim was to provide data to assist programs in securing and allocating resources to manage the increasingly challenging recruitment process.
Methods: Questions were part of a larger omnibus survey conducted by the Council of Academic Family Medicine (CAFM) Educational Research Alliance (CERA). Specific questions were asked regarding how many interviews each program offered and completed; interview budget; additional funds spent on recruitment; reimbursements; and resident, faculty, and staff hours used per interviewee.
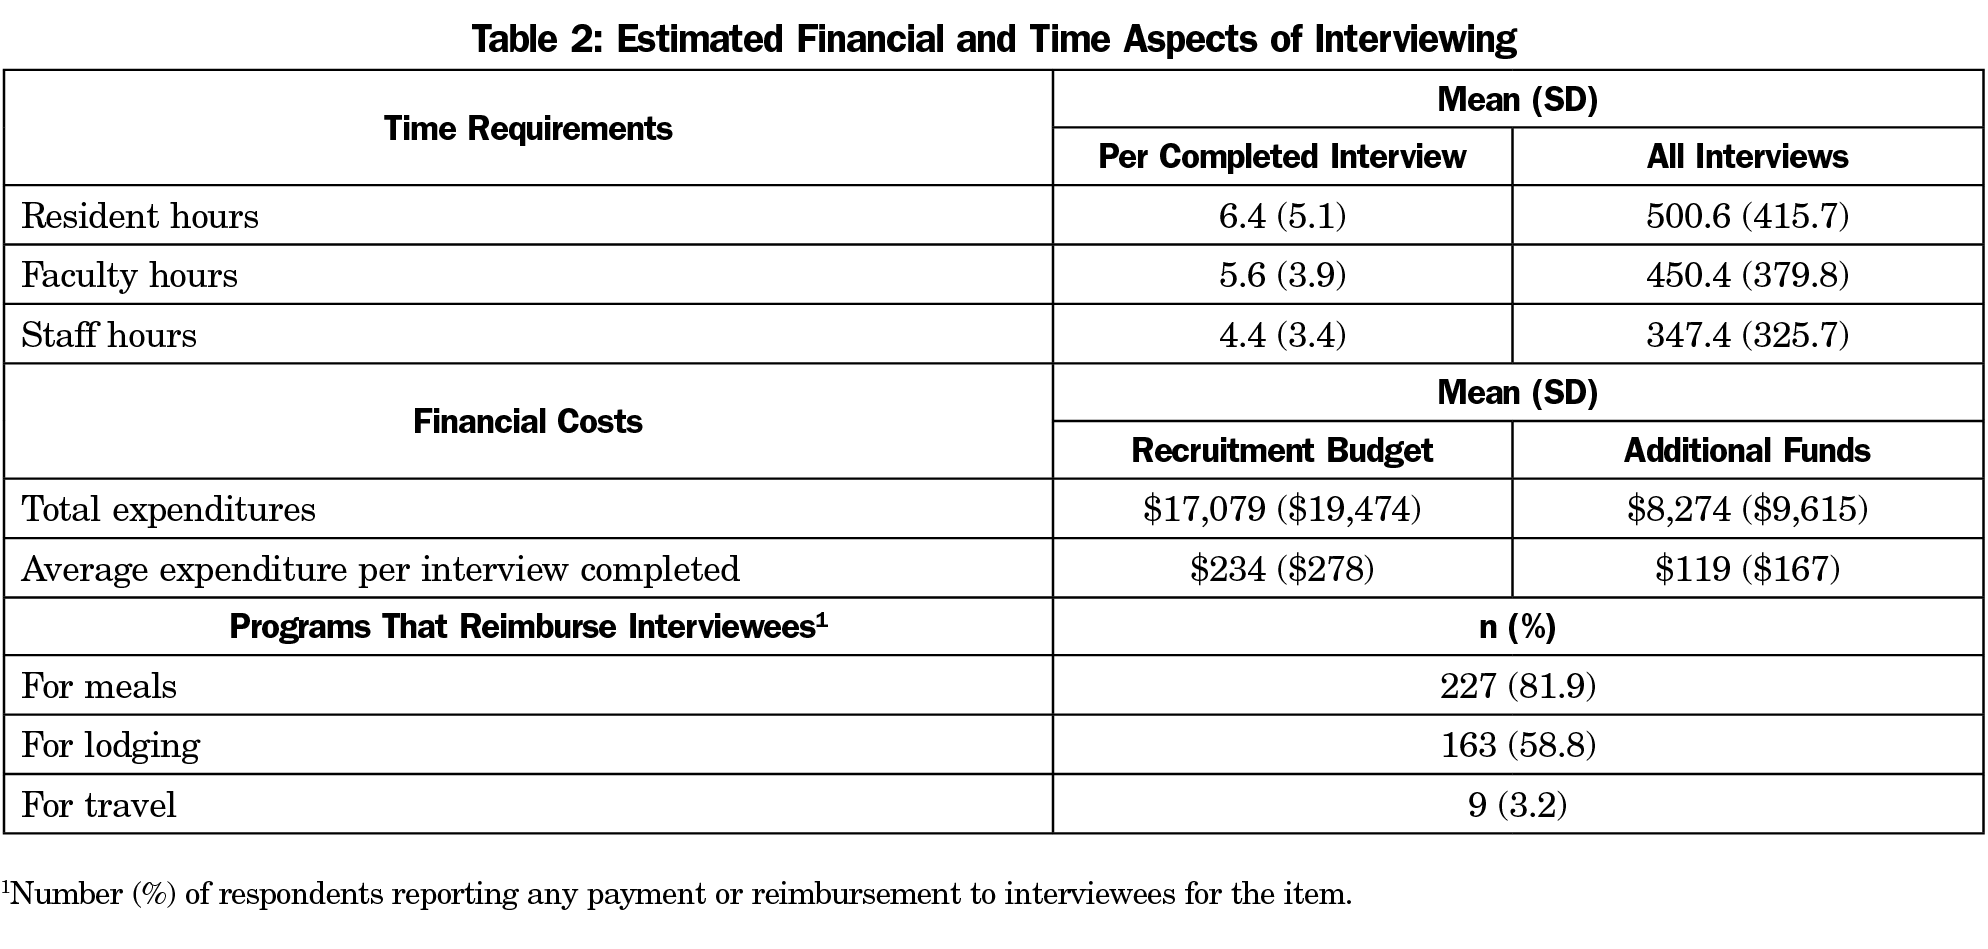
Results: The response rate was 53% (277/522). Program directors estimated that residents devoted 6.4 hours (95% CI 6, 7) to each interview, faculty 5.6 hours (95% CI 5, 6), and staff 4.4 hours (95% CI 4, 5). The average budget for interviewing per program was $17,079 (±$19,474) with an additional $8,274 (±$9,615) spent on recruitment activities. The average amount spent per applicant was $213 (±$360), with $111 (±$237) in additional funds used for recruitment. Programs were more likely to pay for interviewee meals (82%) and lodging (59%) than travel (3%).
Conclusions: As individual programs face increasing pressure to demonstrate value for investment in recruiting, data generated by this national survey enables useful comparison to individual programs and sponsoring organizations. Results may also contribute to national discussions about best practices in resident recruitment and ways to improve efficiency of the process.
Resident recruitment is one of the most important and demanding responsibilities of graduate medical education (GME) programs. In 2018, 557 family medicine residency programs offered 3,629 positions in the National Resident Matching Program (NRMP).1 A national survey of family medicine program directors (N=152) reported that programs received an average of 1,322 applications, equivalent to 189 per available position.2 On average, family medicine programs invited 113 applicants to interview, completed interviews with 85, and ranked 72 applicants for seven positions.2 The 2018 match was the largest on record both for applicants and positions offered.1 Although residency programs report already being overwhelmed with applications, increasing numbers of applications are predicted due to the synergistic effect of larger numbers of applicants and increased numbers of applications made by each applicant.3
The resource demands of recruitment are among the principal reasons for calls for process reform by programs in multiple specialties.3-11 Nevertheless, very little national information is available on the costs to programs of resident recruitment or the resources allocated by hospitals and other program sponsors. We identified only one relevant study, a 2009 survey of residency program directors in internal medicine (N=270). That study estimated a median cost of $14,162 (range $9,741-$22,605) to programs for each NRMP-matched position. The total included an average of $1,042 (range $733-$1,565) per completed interview.12 Community-based programs spent more than university-affiliated programs, and university-based programs reported the lowest expenditures.12
Studies of student-reported expenses during residency interviewing show that programs vary significantly in covering costs and providing reimbursement.13,14 Meals are the most common expenses covered by programs. Students report that programs seldom contribute to accommodation and rarely to travel expenses.13,14 In general, students report that family medicine programs provide more financial and in-kind support to interviewees than other specialties.13,14
The purpose of this study was to provide a national snapshot of estimated costs of resident recruitment among US family medicine residency programs based on program characteristics such as region, size, and type (academic, community-based/university-affiliated, and community-based/nonaffiliated). This study also sought to identify and quantify the principal components of recruiting and interviewing expenses, including faculty, resident, and staff time; reimbursement of travel expenses, lodging, and meals; and other costs such as recruitment at national conferences and recruitment materials. Our aim was to provide data to assist programs in securing and allocating resources to manage the increasingly challenging resident recruitment process. Study findings can also inform and stimulate national discussion of best practices in developing a more effective and efficient process of resident recruitment.
The questions were part of a larger omnibus survey conducted biannually by the Council of Academic Family Medicine (CAFM) Educational Research Alliance (CERA).15 The CERA steering committee evaluated questions for consistency with the overall aim of the omnibus survey, readability, and existing evidence of reliability and validity. Pilot testing was done with family medicine educators who were not part of the target population. Questions were modified following pretesting for flow, timing, and readability. The American Academy of Family Physicians Institutional Review Board approved the project in January 2018. Data were collected from January to February 2018.
The survey was sent to all program directors leading family medicine programs accredited by the Accreditation Council for Graduate Medical Education (ACGME). Programs were identified by the Association of Family Medicine Residency Directors (AFMRD). E-mail invitations to participate included a link to the online survey. Six follow-up emails were sent at weekly intervals to encourage nonrespondents to complete the survey. As part of the standard CERA survey, program directors were asked to identify their residency programs as either university-based, community-based/university-affiliated, community-based/nonaffiliated, or other (eg, military, community health center); and to report the size of their programs by number of residents (less than 19, 19 to 31, or more than 31). In order to stratify programs based on region, US states were grouped into four geographic regions: Northeast (New Hampshire, Massachusetts, Maine, Vermont, Rhode Island, Connecticut, New York, Pennsylvania, and New Jersey), South (Florida, Georgia, South Carolina, North Carolina, Virginia, Washington, DC, West Virginia, Delaware, Maryland, Kentucky, Tennessee, Mississippi, Alabama, Oklahoma, Arkansas, Louisiana, and Texas), Midwest (Wisconsin, Michigan, Ohio, Indiana, Illinois, North Dakota, Minnesota, South Dakota, Iowa, Nebraska, Kansas, and Missouri), and West (Montana, Idaho, Wyoming, Nevada, Utah, Arizona, Colorado, New Mexico, Washington, Oregon, California, Alaska, and Hawaii). Program directors were also asked to report their total years of experience as a program director and time directing the current program.
Specific questions were asked for this project regarding how many interviews each program offered to applicants; how many interviews were completed; the size of the annual interview budget; additional funds spent on recruitment; any payments/reimbursements made for interviewee travel, lodging, and/or meals; and faculty, administrative staff, and resident hours used per completed applicant interview. See the Appendix (https://journals.stfm.org/media/2211/nilsen-appendix-fm2019.pdf) for specific CERA questions used in this study.
Any response that was identified as an outlier by SPSS in stem-and-leaf plots was removed from the data set before analysis. This included responses over $99,000 in “additional money used for recruitment,” and any hours over 40 reported per interviewee for residents, faculty, and staff. Thus, the number of responses and response rate varies slightly between questions. This decision was made because we suspected that these were errors or metaphorical numbers, intended to represent a large amount, rather than actual numbers. Also, due to the small number of “other” types of programs (eg, military, community health center), their data was excluded from this study to limit the possibility of their identification.
Descriptive analyses (means, standard deviations, confidence intervals, and percentages) were used to describe respondents by key variables such as residency program region, program size, and program type, and also to describe the average time and financial costs of interviewing. Chi square analyses were used to determine the frequency and percentage of responses based on the key variables, and to determine whether or not there was a statistically significant difference between them. Independent t-tests were used to determine if there were statistically significant differences between groups when compared to one another. Pearson correlations were also used to determine if program director experience as defined by their total number of years in the position was related to the overall program budget or expenditures. All data analyses were performed using SPSS version 24.0 (IBM, Armonk, NY) and Microsoft Excel.
Population and Demographics
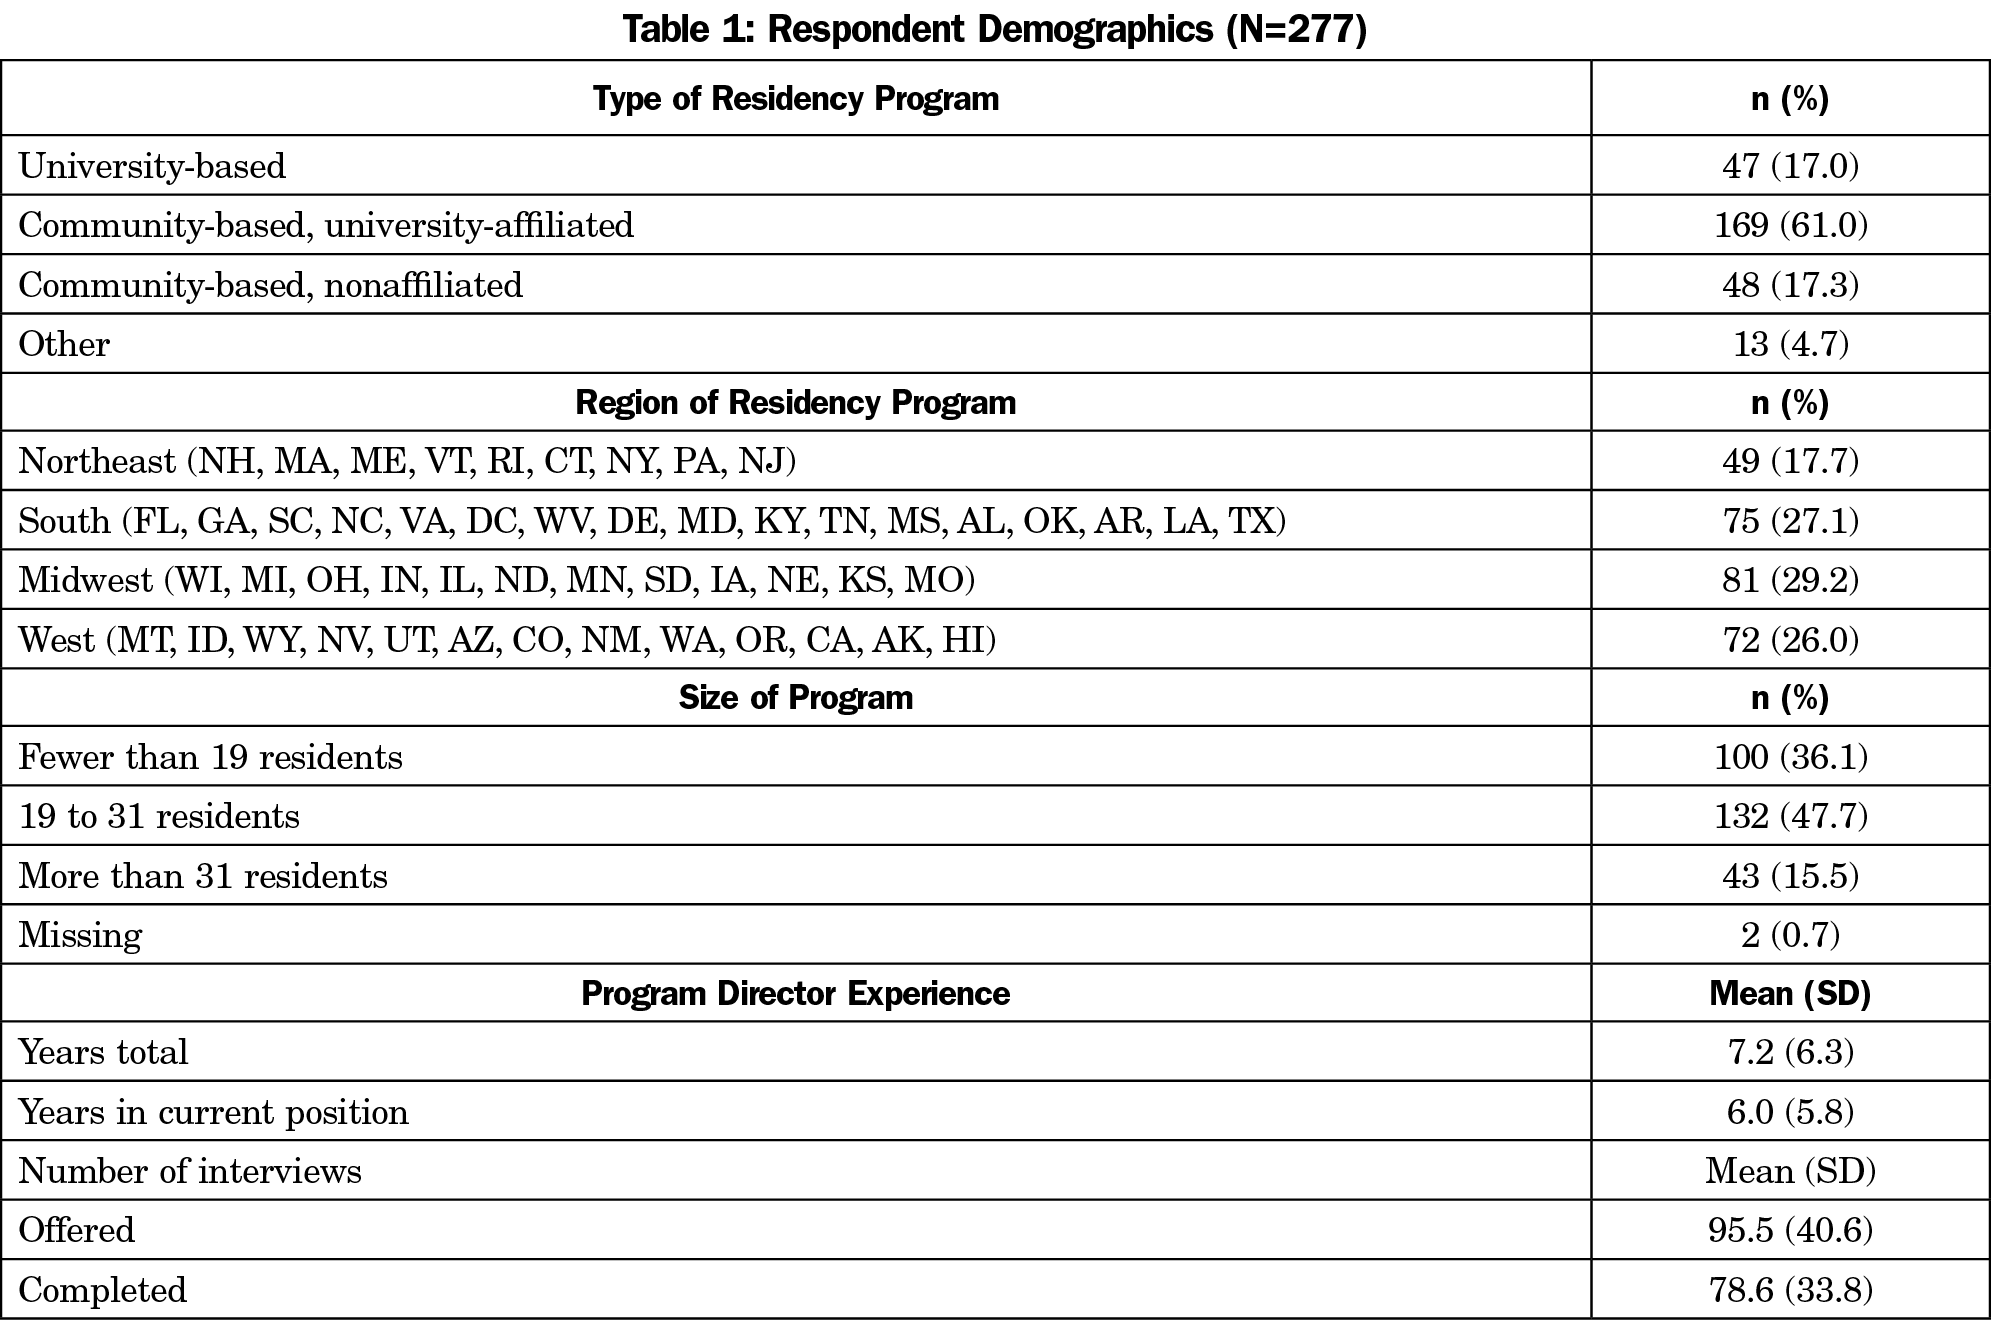
Of the 549 program directors identified by AFMRD, 13 had previously opted out of CERA surveys, and 14 e-mails could not be delivered, resulting in a sample size of 522. The final response rate for our survey questions was 53% (277/522). Respondents reported a range of less than 2 months to 33 years’ experience as a program director, with a mode of 2 years and a mean of 7.2 (±6.3) years (Table 1).
The programs surveyed were generally representative of programs nationwide, but community-based/university-affiliated programs were underrepresented in the sample (61% vs 76.5% nationally; χ2 [1, n=628]=14.8, P=.0001). University-based programs were overrepresented (17% vs 10%), but this was not statistically significant. All regions were represented, with the largest proportion of responses coming from the Midwest (29%).
Overview of Resource Expenditures
Time Commitment. In order to calculate the overall time spent during the interview process, the number of hours each program director estimated per individual interviewee for residents, faculty, and staff was multiplied by the number of completed interviews. Respondents reported offering between two and 300 interviews (96±41) and completing between two and 250 interviews (77±34). On average, program directors estimated that residents devoted 6.4 (95% CI 5.9, 7.1) hours to each interviewee, and 501 (95% CI 452, 550) hours to all interviewees combined. Faculty members were estimated to spend an average number of 5.6 hours per interviewee (95% CI 5.2–6.1), for a total of 450 (95% CI 405, 495) hours for all interviews; and staff an average of 4.4 hours per interviewee (95% CI 4, 5), for a total of 347 (95% CI 313, 390) hours overall (Table 2).
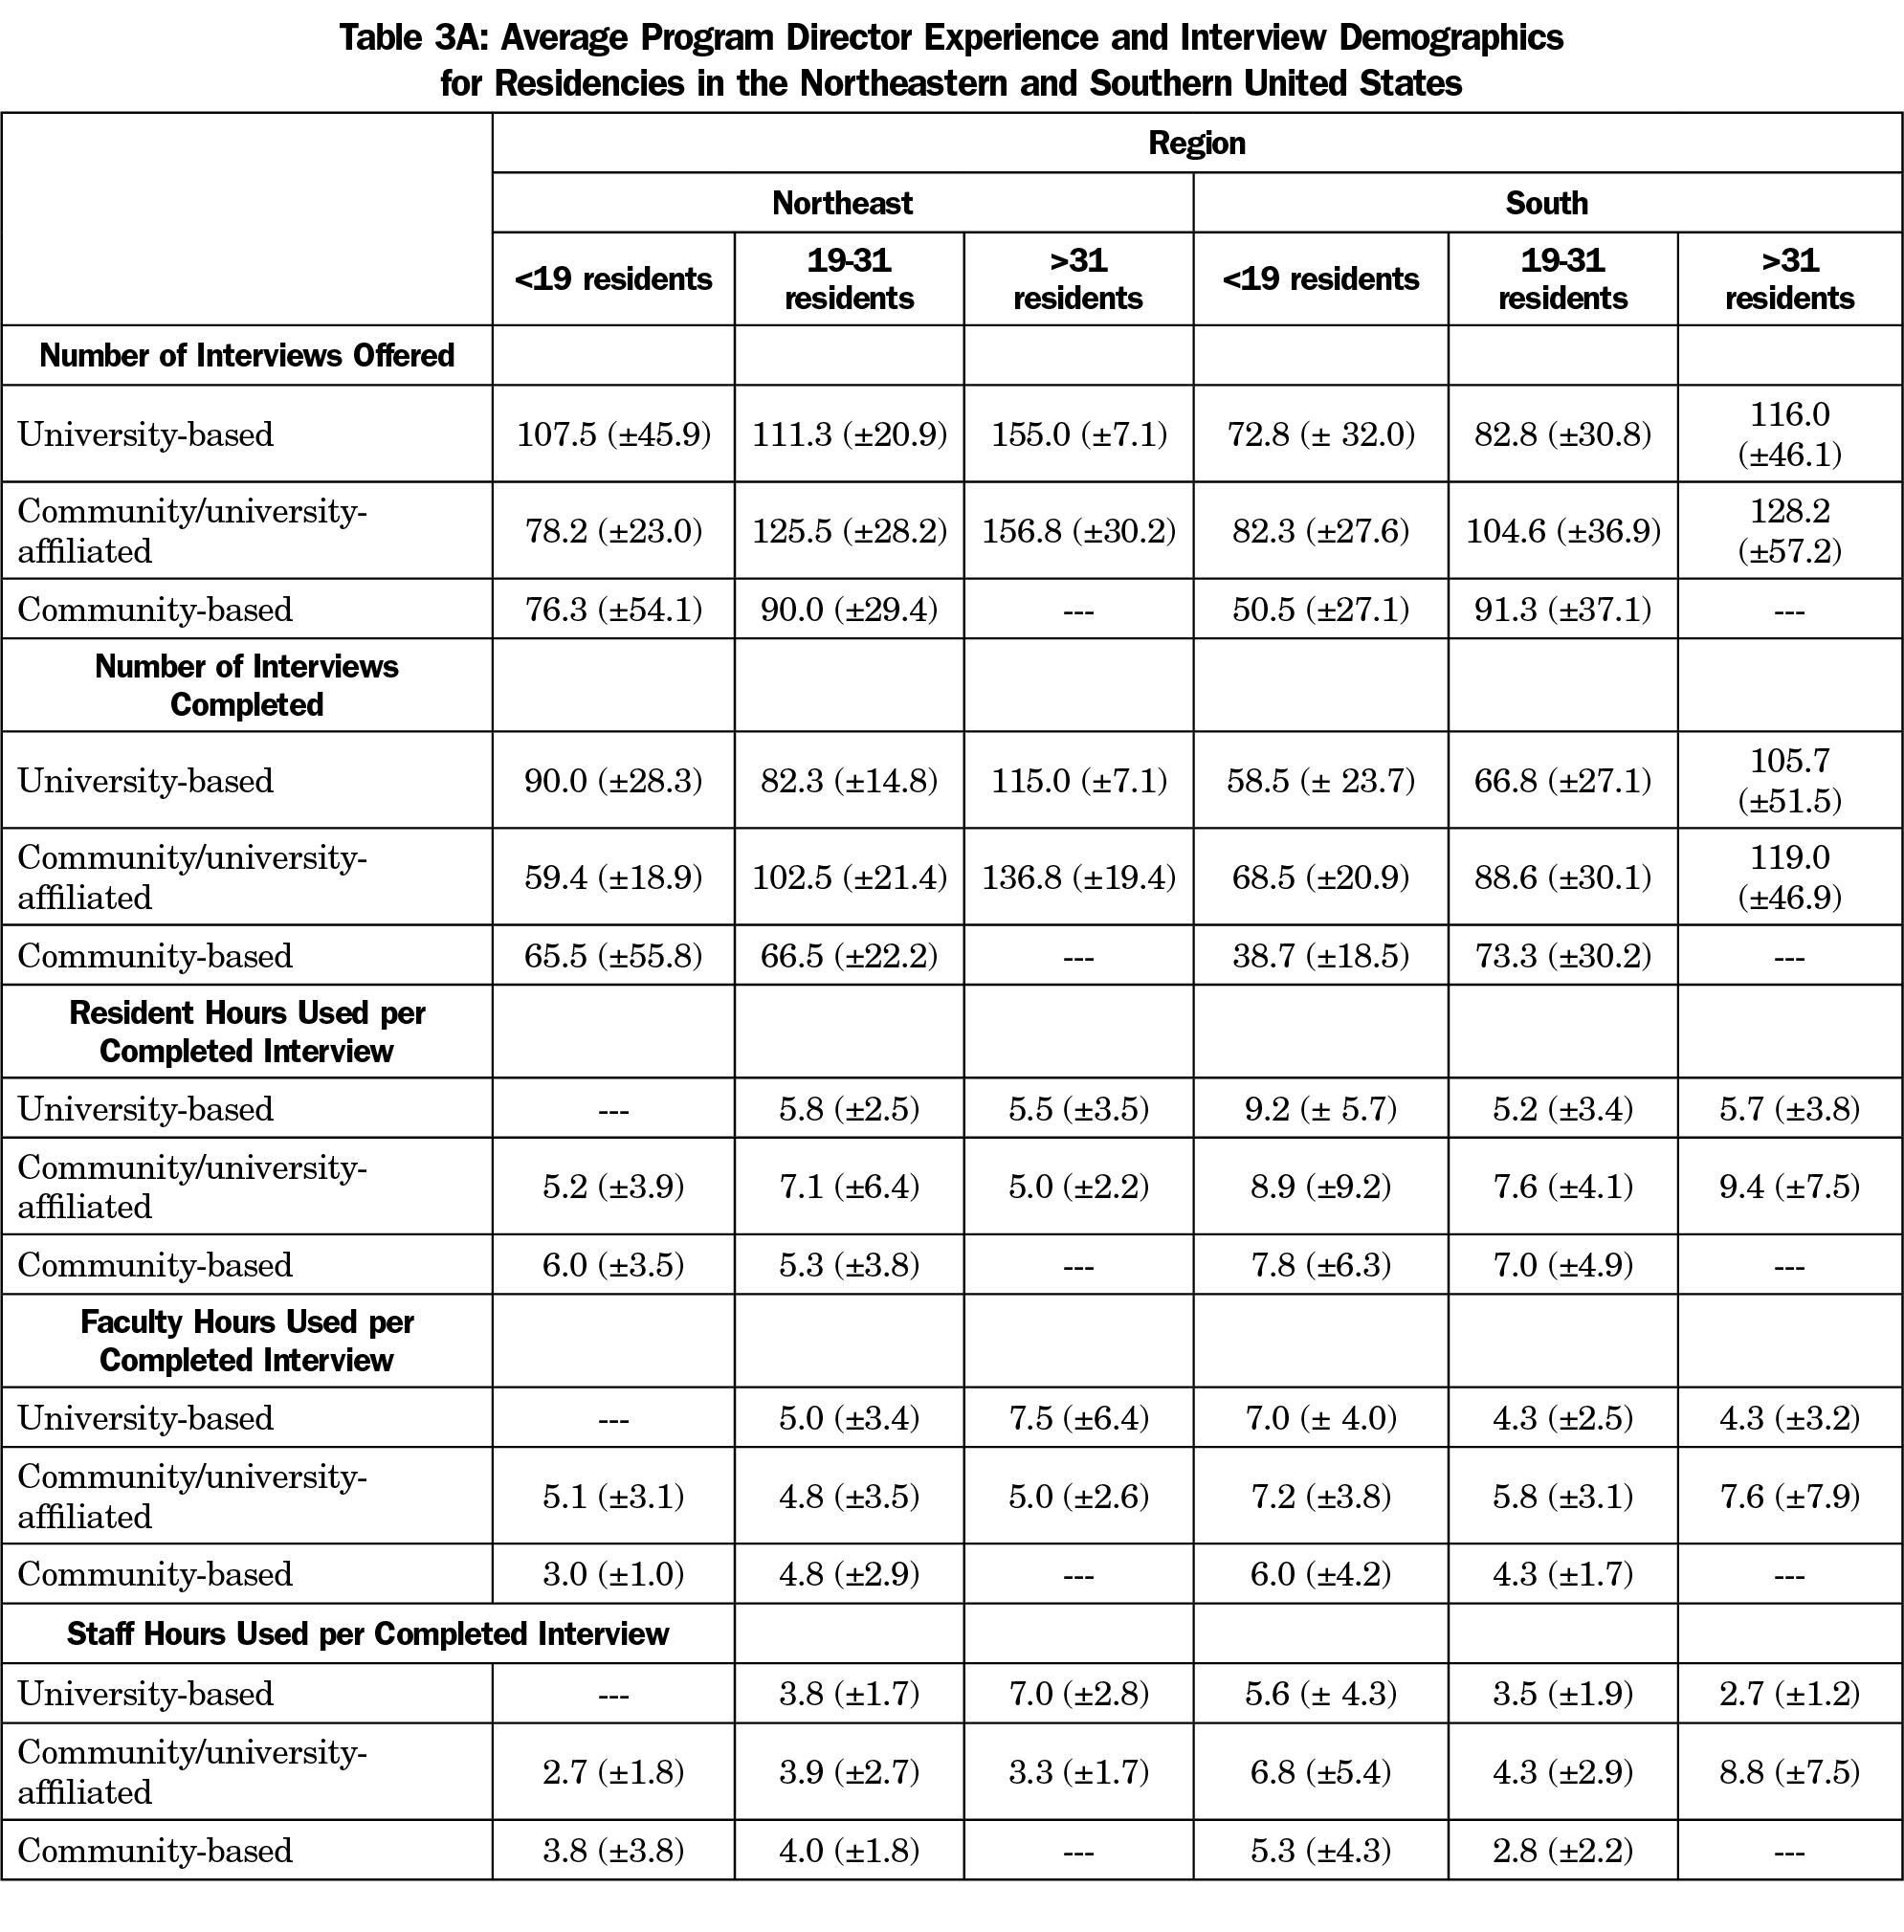
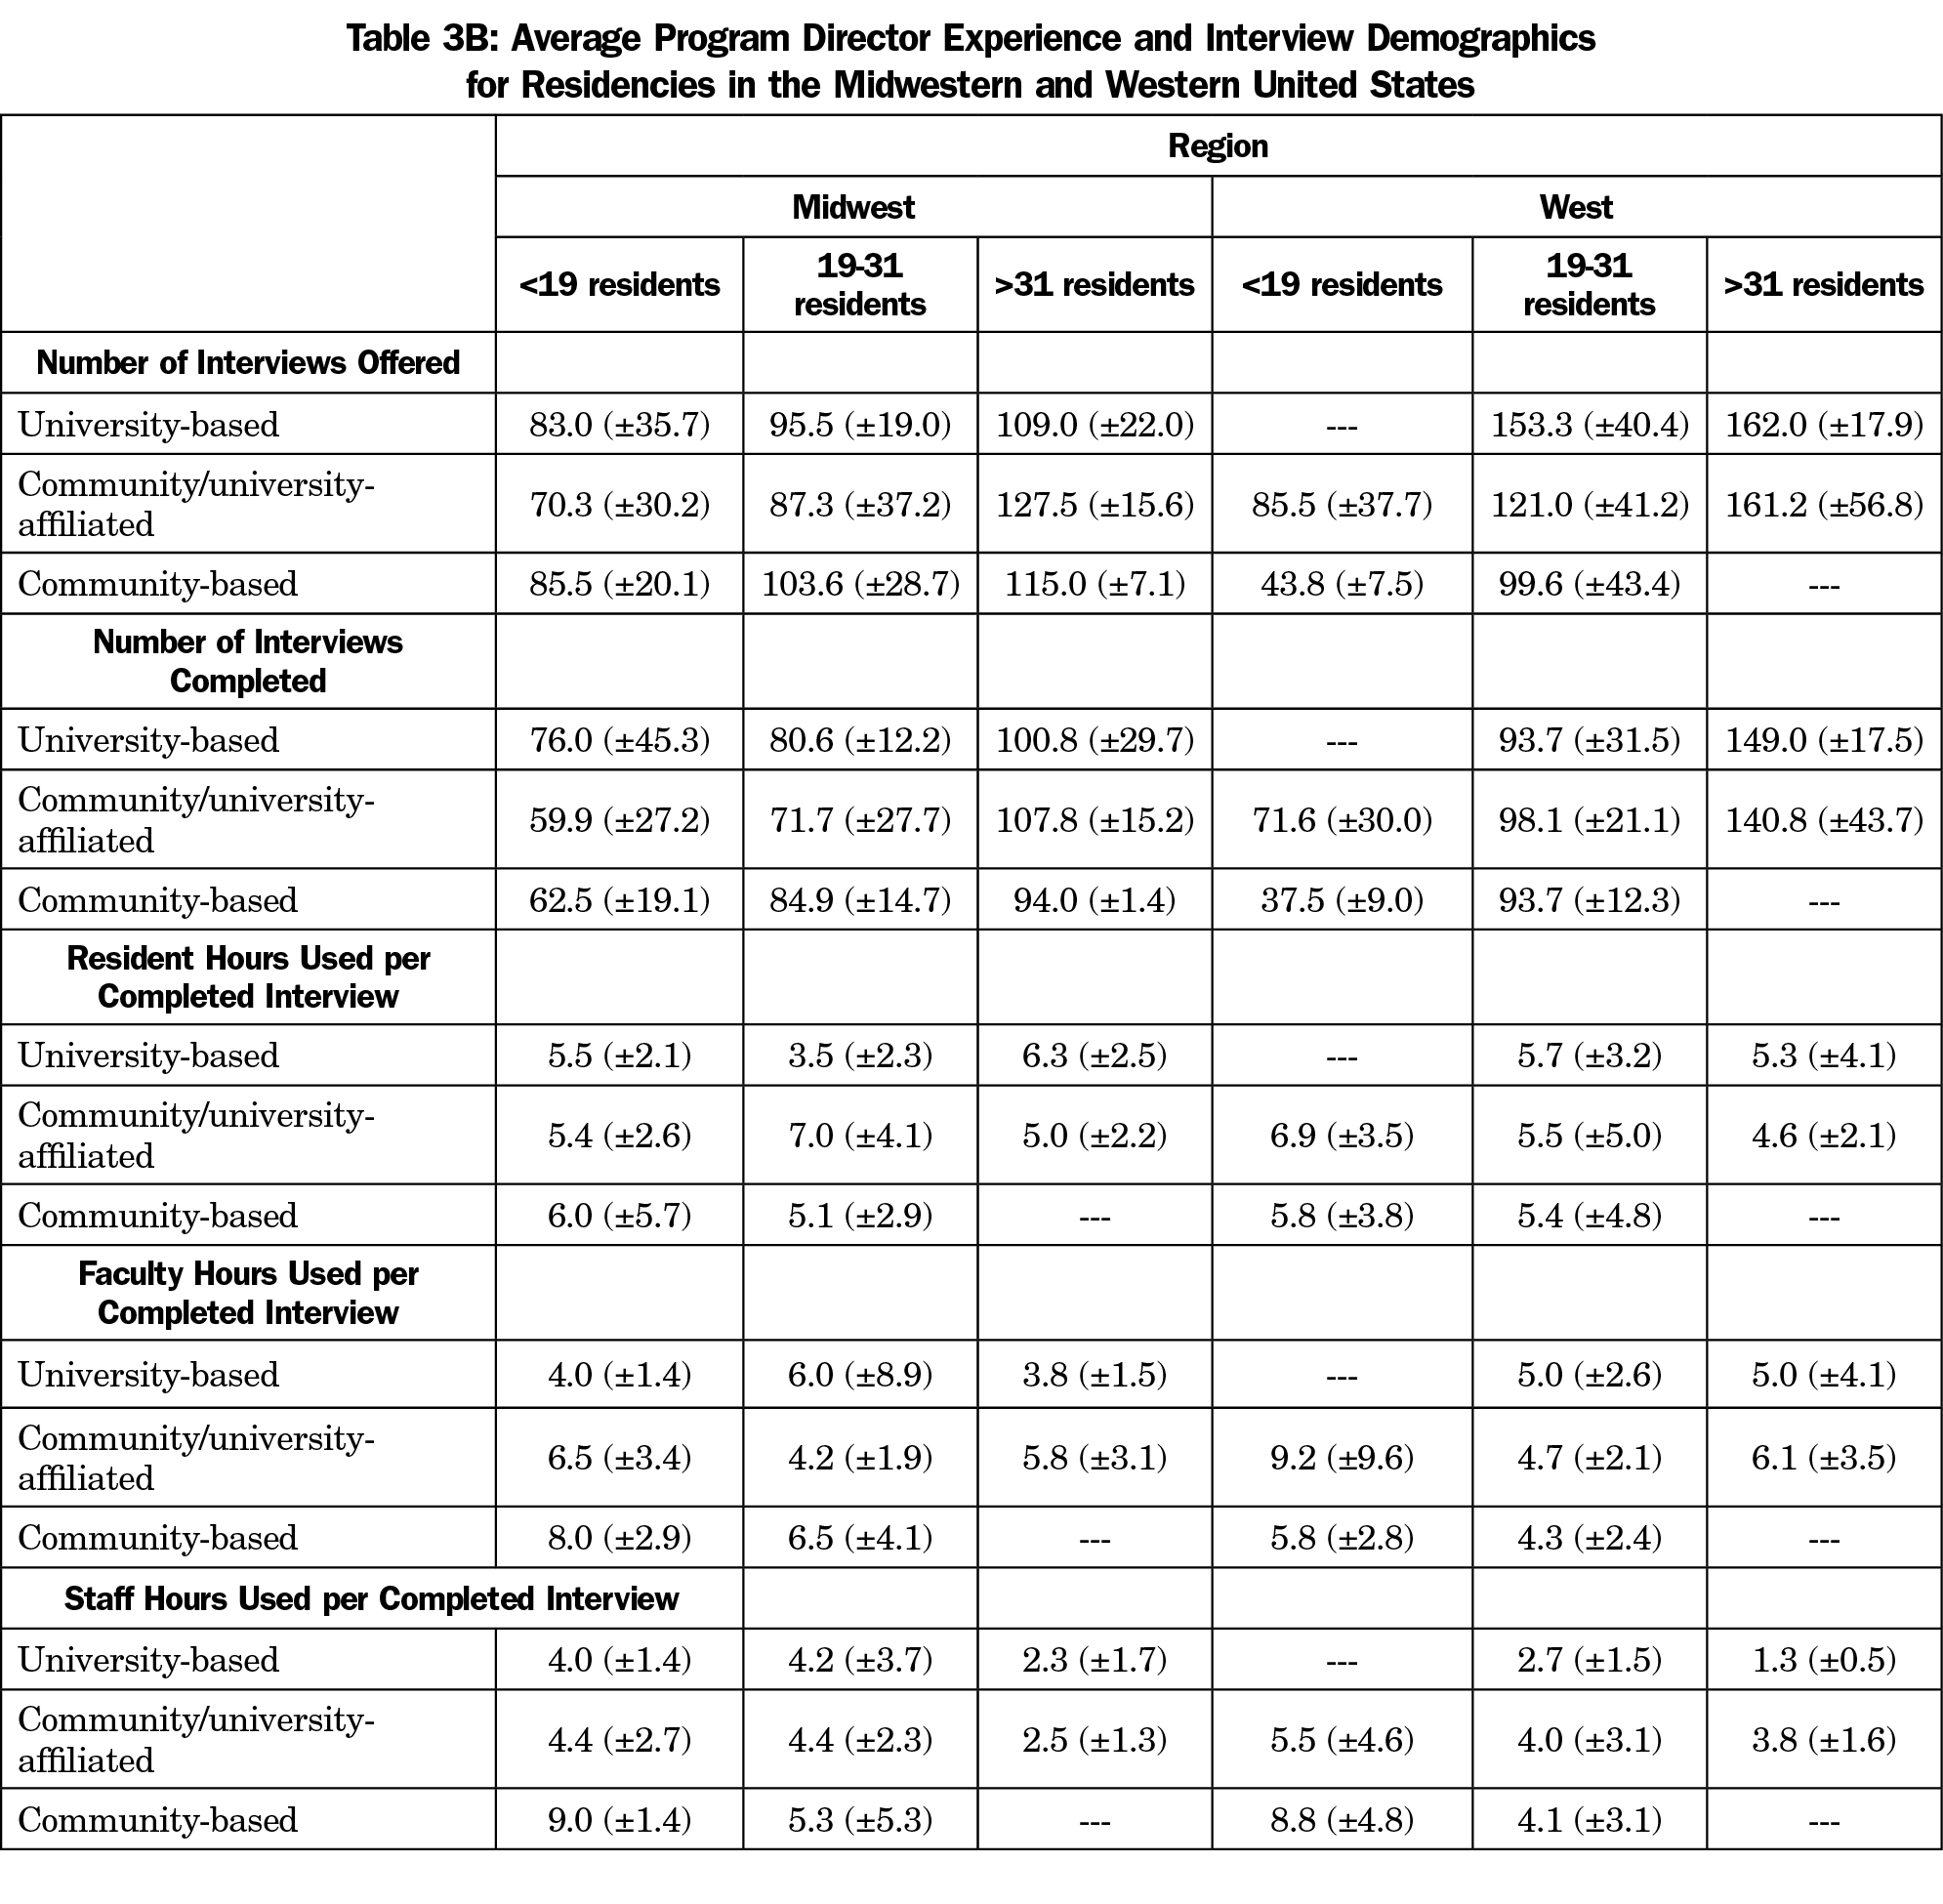
There were no statistically significant differences in the amount of time spent with interviewees based on geographic region. The lowest estimate for residents (4.6±2.1 hours) was given by large community/university-affiliated programs in the western region and the highest (9.4±7.5) hours by similar programs in the southern region. For faculty time, the lowest estimates (4.0±1.4 hours) were from university-based programs with fewer than 19 residents in the Midwest and the highest (9.2±9.6 hours) from community/university affiliated programs with fewer than 19 residents in the western region. Estimates of staff time ranged from a low of 1.3 hours (±0.5) by large university-based programs in the western region to a high of 9.0 hours (±1.4) reported by small community-based programs in the mid-west. This difference was statistically significant (t[5]=7.7, P=.0001]. Tables 3A and 3B show information by program type, region, and size.
Budgets and Expenditures. The average amount spent per applicant regardless of interview status was $213 (±$360), with $111(±$237) in additional funds used for recruitment. For each completed interview, $234 (±$278) was spent, with $119(±$167) in additional funds used for recruitment (Table 2). The largest interviewing budgets ($68,750±$68,144) were reported by large community/university-affiliated programs in the Northeast; these programs also reported the most additional expenditures devoted to recruitment ($27,250±$23,824). The smallest interview budgets ($4,025±$2,086) and additional expenditures ($1,000±$707) were reported by small university-based programs in the Northeast region. However, due to the differences in the sizes of the programs, the expenditures between the largest ($96,000±$91,898) and smallest ($5,025±$2,793) interview budgets was not statistically different (t[4]=-1.3, P=0.26).
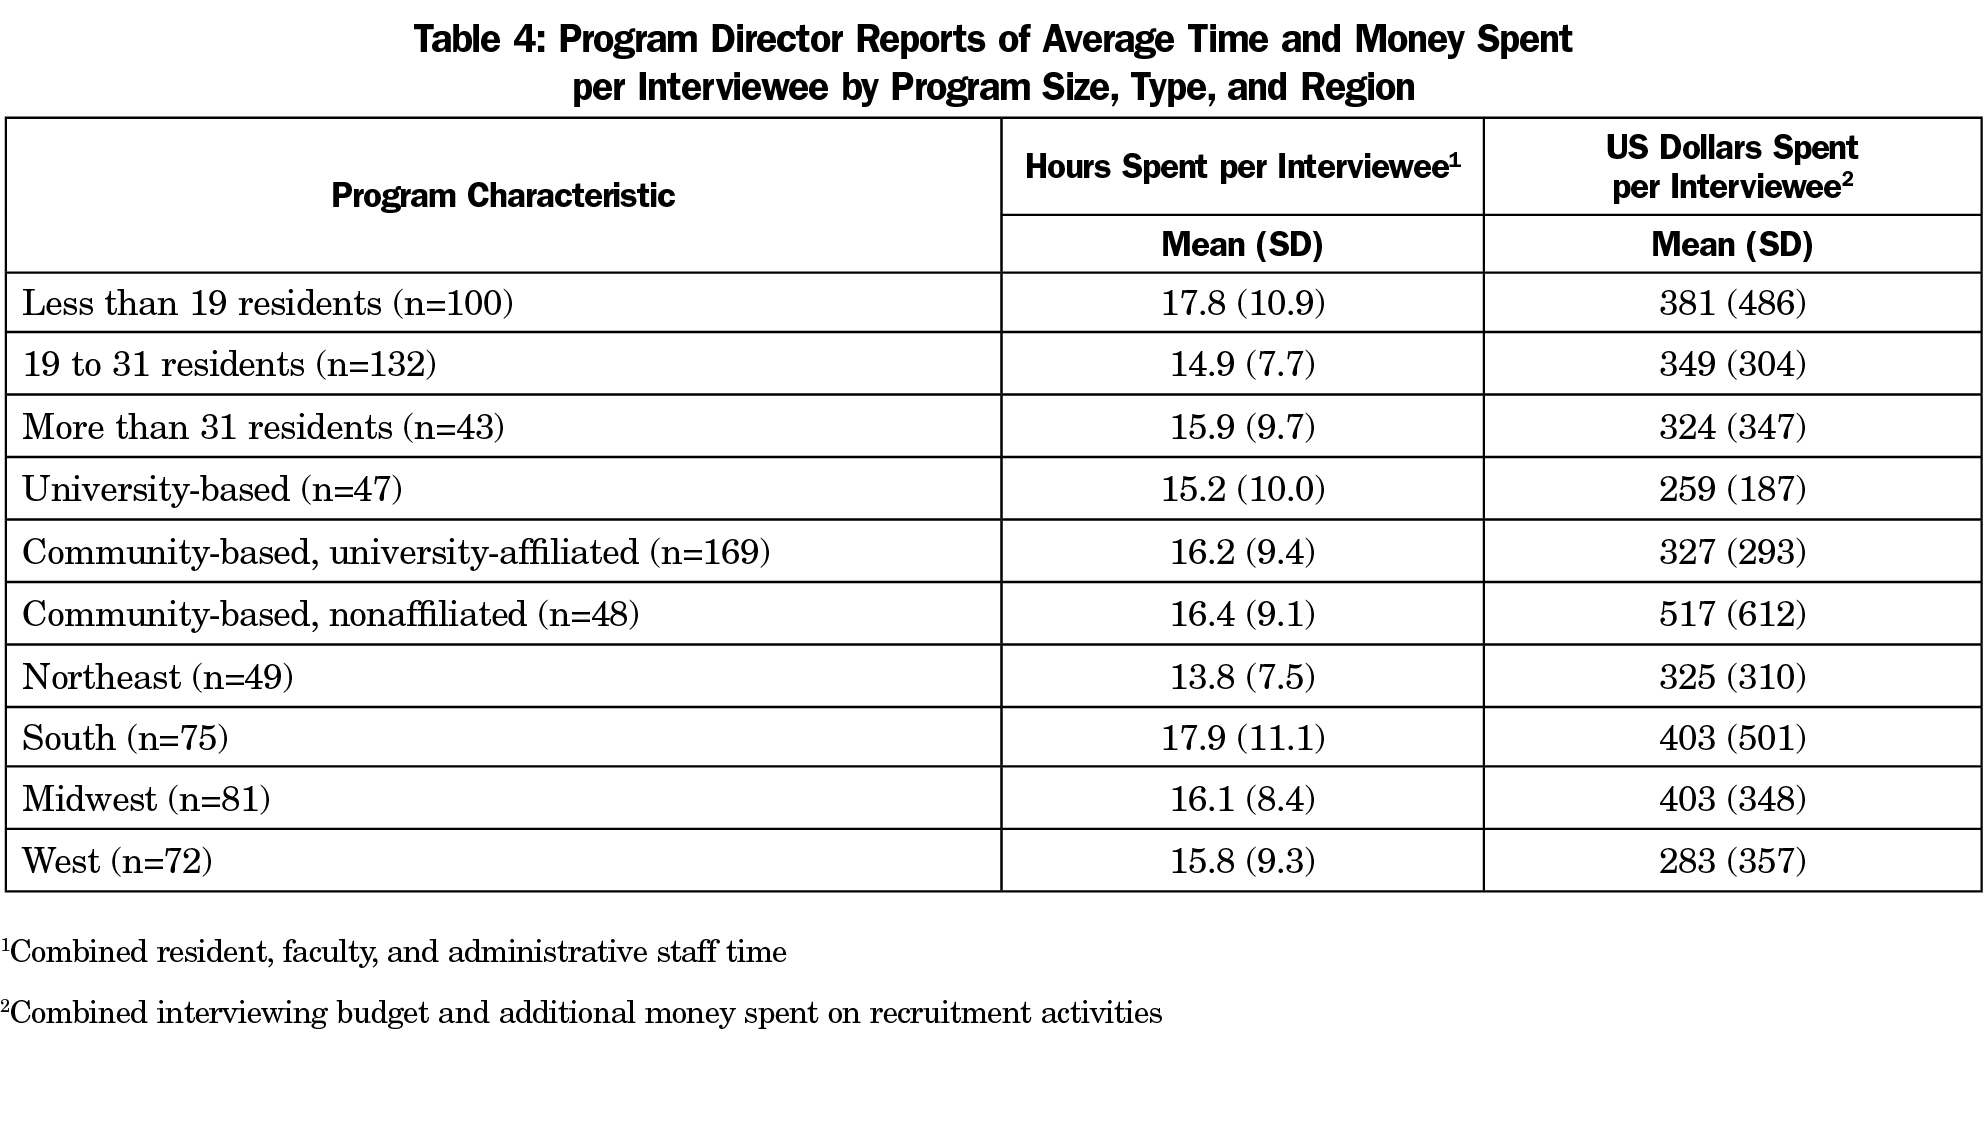
When combining the total residency interviewing budgets and additional recruitment money spent, the only significant differences were seen between university-based and community-based/nonaffiliated programs (t[93]=2.77, P=.007), community-based/university-affiliated and community-based/nonaffiliated programs (t[215]=3.01, P=.033), and between programs in the Midwest and the West (t[151]=-2.1, P=.04; Table 4]. Community-based/nonaffiliated programs spent more than either university-based or university-affiliated programs. Programs in the West spent less than those in the Midwest.
Using partial correlation to control for program size, no significant correlations were found between the number of years of program director experience and the total interviewing budget (r=.07, P=.27, n=271), or the additional money spent on recruitment (r=.06, P=.34, n=271).
Payment for Lodging, Meals, or Travel. Programs were more likely to pay for interviewee meals (81.9%; χ2[1]=353.1, P<.0001, 95% CI 73.3 to 83.3) and lodging (58.8%; χ2[1]=202.7, P<.0001, 95% CI 49.5 to 61.8) than travel (3.2%; Table 2). Using partial correlation to control for program size, no significant correlations were found between the number of years of program director experience and whether programs reimbursed applicants for travel (r=.07, P=.25, n=268), meals (r=-.10, P=.11, n=268), or lodging (r=-.11, P=.08, n=268).
These data demonstrate the magnitude of program resources consumed by recruitment and interviewing for residents, with an average of 6.4 hours of resident time, 5.6 hours of faculty time, and 4.4 hours of administrative staff time, and an average of $234 per completed residency interview. Additionally, the majority of family medicine residency programs (81.9%) involved in this study paid for applicant meals during the interviewing process, and more than half reimbursed for travel expenses (58.8%). However, these data do not include additional substantial costs to individuals and programs. Faculty and resident time for recruitment and interviewing must compete with patient care, education, research, and other responsibilities. This time burden is likely unevenly distributed as programs are likely to rely more heavily on specific individuals whose personalities and interpersonal skills are suited to the interviewing process. Any adverse effects of recruiting and interviewing activities on the education of such residents have not been studied. Similarly, lost productivity of faculty in education, clinical service, administration, and research due to recruiting has not been quantified and may be significantly higher for some individuals. Among staff, program coordinators are often the first line in application screening, and are the principal contact for applicants for information, interview scheduling, and overall coordination. Hospital systems often evaluate ACGME Program Requirements for coordinator requirements without considering the essential role of the coordinator in the overall recruitment effort.
Also, the similar internal medicine study by Brummond and colleagues12 showed an average expense of $1,042 (range: $733-$1,565) per completed interview, but this is due to the fact that the Brummond data accounts for the actual monetary cost of the time that faculty, residents, and staff spent on interviews, whereas our study did not. If the cost of the resident, faculty, and administrative staff time were included, the actual cost of recruitment and interviewing for family medicine residencies would be much higher. Overall, interviewing budgets (average of $17,079), combined with additional funds used for recruitment (average of $8,274) do not convey the enormous time investment for residents, faculty, and staff.
Our findings show differences in expenditures and time commitment for resident recruitment based on program region, type, and size. The number of hours spent in resident recruitment of resident, faculty, and staff in the South region was much greater in programs fewer than 19 residents than those with 19 residents or more. Similarly, the number of hours of faculty and staff time spent in resident recruitment in Midwest and West region was much greater in programs fewer than 19 residents than those with 19 residents or more. Smaller programs may be spending more time in recruitment activities if only one or two people are assigned to review applications and interview applicants, as opposed to large programs which may be able to spread the workload out among more people. Programs also varied considerably in payment for interviewee lodging. Frequent payment for travel was only reported for university-based programs in the northeast region. Program director experience does not appear to be significantly related to the volume or types of resource use reported.
Generalization of our findings is limited by the response rate and underrepresentation of community-based/university-affiliated programs in our sample. In addition, data are self-reported and no literature or external information is available to validate program directors’ reports of budgets and/or time spent. These data also only cover the program resources consumed by interviewing, which is just a portion of the resources required for recruitment. There is also significant time spent reviewing applications for students who are not interviewed, as well as the time spent on residency fairs, local student events, and second-look experiences. The study is also limited by the inablity to correlate the information to the number of PGY-1 positions recruited for in each program.
However, the data generated by this national survey should be useful to individual programs and sponsoring organizations by providing comparisons among programs with similar characteristics. A prior study with fourth-year medical students applying to multiple specialties discovered that at least some students apply to all the residency programs they can, and then sort them out later, even using some interviews as practice for “more important” interviews!16 This seems like a huge drain on resources that could be used in other ways. The results of this study, and others like it, may contribute to national discussions concerning development of best practices in resident recruitment and ways to improve the efficiency of the process. These discussions may help reform the process of residency interviewing by determining the scope of the time and cost commitment by both programs and applicants, and finding ways to take the burden off of both groups by limiting the number of residencies to which an applicant can apply.
Medical students would be required to do their due diligence prior to applying to multiple residencies, and then only apply to programs they actually want to attend. This would lower the number of applications submitted, decrease the number of applicants that would need to be screened and offered an interview, and ultimately decrease the number of interviews completed. Certainly, freeing up more time for clinical duties for both residents and faculty would positively impact the residencies financially, as well as freeing up more time for residency education.
Despite the caveats above, this study provides the first national description of recruitment expenses and time commitments. It must be stressed that this is purely a big picture descriptive study of current practices as reported by survey participants. The results should not be interpreted as optimal expenditures for resident recruitment or established as goals for individual programs. Deciding the optimal investment in resident recruitment for an individual program is a complex and challenging process, driven by local as well as national considerations. Even within a single geographic region, programs of similar size and types may require very different budgets and resources for optimal recruitment. Much more research is needed on this issue, both at the national and local levels. Studies are also needed to compare recruitment costs and practices among specialties in order to develop best practices for all programs nationwide.
Acknowledgments
The authors thank the faculty and staff who support the CERA program, as well as Dr Philip Dooley for his feedback.
References
- National Resident Matching Program. Results and Data: 2018 Main Residency Match. Washington, DC: National Resident Matching Program; 2018.
- National Resident Matching Program, Data Release and Research Committee. Results of the 2018 NRMP Program Director Survey. Washington, DC: National Resident Matching Program; 2018.
- Gliatto P, Karani R. The residency application process: working well, needs fixing, or broken beyond repair? J Grad Med Educ. 2016;8(3):307-310. https://doi.org/10.4300/JGME-D-16-00230.1
- Aagaard EM, Abaza M. The residency application process‑burden and consequences. N Engl J Med. 2016;374(4):303-305. https://doi.org/10.1056/NEJMp1510394
- Claiborne JR, Crantford JC, Swett KR, David LR. The plastic surgery match: predicting success and improving the process. Ann Plast Surg. 2013;70(6):698-703. https://doi.org/10.1097/SAP.0b013e31828587d3
- Chang CW, Erhardt BF. Rising residency applications: how high will it go? Otolaryngol Head Neck Surg. 2015;153(5):702-705. https://doi.org/10.1177/0194599815597216
- Weissbart SJ, Kim SJ, Feinn RS, Stock JA. Relationship between the number of residency applications and the yearly match rate: time to start thinking about an application limit? J Grad Med Educ. 2015;7(1):81-85. https://doi.org/10.4300/JGME-D-14-00270.1
- Naclerio RM, Pinto JM, Baroody FM. Drowning in applications for residency training: a program’s perspective and simple solutions. JAMA Otolaryngol Head Neck Surg. 2014;140(8):695-696. https://doi.org/10.1001/jamaoto.2014.1127
- Malafa MM, Nagarkar PA, Janis JE. Insights from the San Francisco Match rank list data: how many interviews does it take to match? Ann Plast Surg. 2014;72(5):584-588. https://doi.org/10.1097/SAP.0000000000000185
- Baroody FM, Pinto JM, Naclerio RM. Otolaryngology (urban) legend: the more programs to which you apply, the better the chances of matching. Arch Otolaryngol Head Neck Surg. 2008;134(10):1038-1039. https://doi.org/10.1001/archotol.134.10.1038
- Katsufrakis PJ, Uhler TA, Jones LD. The residency application process: pursuing improved outcomes through better understanding of the issues. Acad Med. 2016;91(11):1483-1487. https://doi.org/10.1097/ACM.0000000000001411
- Brummond A, Sefcik S, Halvorsen AJ, et al. Resident recruitment costs: a national survey of internal medicine program directors. Am J Med. 2013;126(7):646-653. https://doi.org/10.1016/j.amjmed.2013.03.018
- Callaway P, Melhado T, Walling A, Groskurth J. Financial and time burdens for medical students interviewing for residency. Fam Med. 2017;49(2):137-140.
- Walling A, Nilsen K, Callaway P, et al. Student expenses in residency interviewing. Kans J Med. 2017;10(3):1-15.
- Seehusen DA, Mainous AG III, Chessman AW. Creating a Centralized Infrastructure to Facilitate Medical Education Research. Ann Fam Med. 2018;16(3):257-260. https://doi.org/10.1370/afm.2228
- Nilsen, KM, Walling A, Callaway P. Unruh G, Scripter C, Meyer M, Grothusen J, King S. “The End Game”- Student perspectives on the MATCH: A focus group study. Med Sci Ed. 2018;28(4):729-737. https://doi.org/10.1007/s40670-018-0627-1.


There are no comments for this article.