Background and Objectives: Previous research has found differences in preparation for entry into family medicine training between graduates of US and Canadian medical schools. However, this research was limited in that it utilized cross-sectional data to examine a longitudinal issue. This study aimed to examine these differences with a longitudinal data set.
Methods: A comparison of the performance on the American Board of Family Medicine (ABFM) In-Training Exam (ITE) between 2014 and 2016 was conducted by examining the performance of Canadian medical school graduates and US medical school graduates longitudinally, as well as cross-sectionally, using independent t tests.
Results: For first-year residents (PGY1), the Canadian 2014/2015 cohort showed significantly higher mean scores than US medical school graduates (USMG) and international medical school graduates (IMG). The Canadian 2015/2016 cohort showed no statistical difference from the USMGs, but did have a significantly higher mean than the IMGs.
For second-year residents (PGY2), the Canadian 2014/2015 cohort showed a significantly lower mean than the USMG cohort, but had a significantly higher mean than the IMG cohort. The Canadian 2015/2016 cohort showed a statistically lower mean than the USMG cohort and no difference compared to the IMG cohort.
Conclusions: Based on a comparison of ABFM ITE scores between 2014 and 2016, the Canadian medical school graduates performed as well as or better than the US graduates upon entry into residency, but performance was reversed for the second year of training. Our results also suggest an equity value of ACGME residency training independent of location of undergraduate medical training.
Due to the inadequacy and unsustainability of the current health care system, there is an urgent need for more and better-trained primary care physicians to meet the society’s health care needs.1,2 The United States and Canada both proposed theoretical concepts emphasizing the importance of training for primary care physicians. For instance, in Canada, “Value Generalism” was put forward in The Future of Medical Education in Canada (FMEC) in 2010,3 which placed an emphasis on primary care by examining an educational system that was deterring students from pursuing careers in primary care specialties for medical schools. Over the past decade, Canadian medical schools have addressed the FMEC recommendations by amending admission policies to have a more diverse student population, and revisiting the roles and responsibilities of their departments of family medicine to ensure the central role of family medicine in their medical schools.
Because the scope of practice of family medicine includes caring for an increasingly diverse population, comparison studies of both the training standards and curricula across countries have been conducted to examine improvements in residency training practices.4,5 A previous study examined the differences in medical knowledge by comparing scores on the American Board of Family Medicine (ABFM) In-Training Exam (ITE) between graduates of US medical schools and Canadian medical schools.6 The results of this study suggested that differences in levels of medical knowledge existed upon entry into family medicine residency training, but these differences were eliminated in the latter stages of training. It also noted that the ability of US programs to successfully prepare their trainees to practice family medicine appeared to be independent of the location of medical education (ie, US medical school or international medical school). Given that the instrument used in this study was designed to test medical knowledge, this finding suggested that US and international medical school graduates continued to acquire medical knowledge in residency at approximately the same rate, while the Canadians continued to acquire medical knowledge at a less appreciable rate. A primary limitation of this study was that it utilized cross-sectional data. The purpose of the current study is to address this limitation by utilizing longitudinal data to examine whether the previous conclusions still hold.
Instrumentation
As a low-stakes examination, the ABFM ITE provides residents an opportunity to take a test that mimics the experience of the ABFM certification examination and provides feedback to both the resident and residency program on the resident’s progress. The ABFM ITE applies the same scale as the certification examination, such that an ITE score represents the ABFM’s best estimate of how a resident would have performed on the certification examination at that point in time. Other studies have shown that the ITE can be used to make predictions about a resident’s future certification examination performance.7 The ITE can also be used to make comparisons over time as it uses the dichotomous Rasch model,8 which adjusts for changes in test difficulty so that individuals are measured using the same scale. In this way we know that changes in test scores are not due to changes in test difficulty, but rather changes in examinee ability. The ITE is normally administered in the last week of October each year, at which time the residents have typically been in their program for approximately 17 weeks when they take the examination. For this reason, the first postgraduate year (PGY-1) ITE score is considered a good indicator of a resident’s readiness for family medicine residency training. The American Academy of Family Physicians’ Institutional Review Board approved this study.
Participants
We compared three distinct cohorts: (1) United States medical school graduates (USMGs), (2) international medical school graduates (IMGs) entering Accreditation Council for Graduate Medical Education (ACGME) family medicine residency training programs, and (3) physicians entering Canadian family medicine residency training programs (CMG) from 2014 to 2016. Although we were unable to match each Canadian resident in our sample to a corresponding medical school, we report all residents as CMGs because approximately 80% of Canadian residents are graduates of Canadian medical schools.9
For 2014, the USMG cohort consisted of family medicine residents enrolled in ACGME-accredited residency programs who graduated from a US medical school (n=7,016). The IMG cohort consisted of family medicine residents enrolled in an ACGME-accredited residency program who graduated from an international medical school excluding Canada (n=3,512). The Canadian cohort consisted of family medicine residents (n=508) from 12 Canadian residency programs who took the ABFM ITE. Two residents who graduated from a Canadian medical school and attended an ACGME-accredited residency program were excluded from the study.
For 2015, the USMG cohort consisted of family medicine residents enrolled in ACGME-accredited residency programs who graduated from a US medical school (n=7,283). The IMG cohort consisted of family medicine residents enrolled in an ACGME-accredited residency program who graduated from an international medical school excluding Canada (n=3,448). The Canadian cohort consisted of family medicine residents (n=595) from 12 Canadian residency programs who took the ABFM ITE. Three residents in 2015 who graduated from a Canadian medical school and attended an ACGME-accredited residency program were excluded from the study.
For 2016, the USMG cohort consisted of family medicine residents enrolled in ACGME-accredited residency programs who graduated from a US medical school (n=7,388). The IMG cohort consisted of family medicine residents enrolled in an ACGME-accredited residency program who graduated from an international medical school excluding Canada (n=3,425). The Canadian cohort consisted of family medicine residents (n=421) from 11 Canadian residency programs who took the ABFM ITE. Five residents who graduated from a Canadian medical school and attended an ACGME-accredited residency program were excluded from the study.
To create the longitudinal data set, the results from all the 3 years were combined to create a single cohort for both USMGs and IMGs, consisting of residents in their first (PGY1), second (PGY2), and third (PGY3) year of residency training from 2014 to 2016. Since Canadian residency programs are only 2 years in duration, two cohorts were constructed: PGY1s in 2014 and PGY2s in 2015; and PGY1s in 2015 and PGY2s in 2016.
Following the merge, the USMG cohort retained 2,251 residents who had ITE scores in all 3 years, while the IMG cohort retained 1,094 residents. The Canadian cohort consisting of PGY1s in 2014 who took the ITE as PGY2s in 2015 again (Canadian 2014/2015) retained 225 residents, while the Canadian cohort of 2015 and 2016 (Canadian 2015/2016) retained 166 residents.
Design
An independent groups design was used to compare the USMG, IMG, and Canadian cohorts for their PGY-1 and PGY-2 ITE scores in years of 2014, 2015, and 2016. The levels of medical knowledge were compared across the countries longitudinally. We performed 2-tailed t tests to determine whether the differences were statistically significant. We also used this same independent groups design and t test methodology to establish whether the Canadian cohorts 2014/2015 and 2015/2016 and ACGME cohorts performed with comparable levels of medical knowledge longitudinally.
Comparisons of ITE Performance Longitudinally
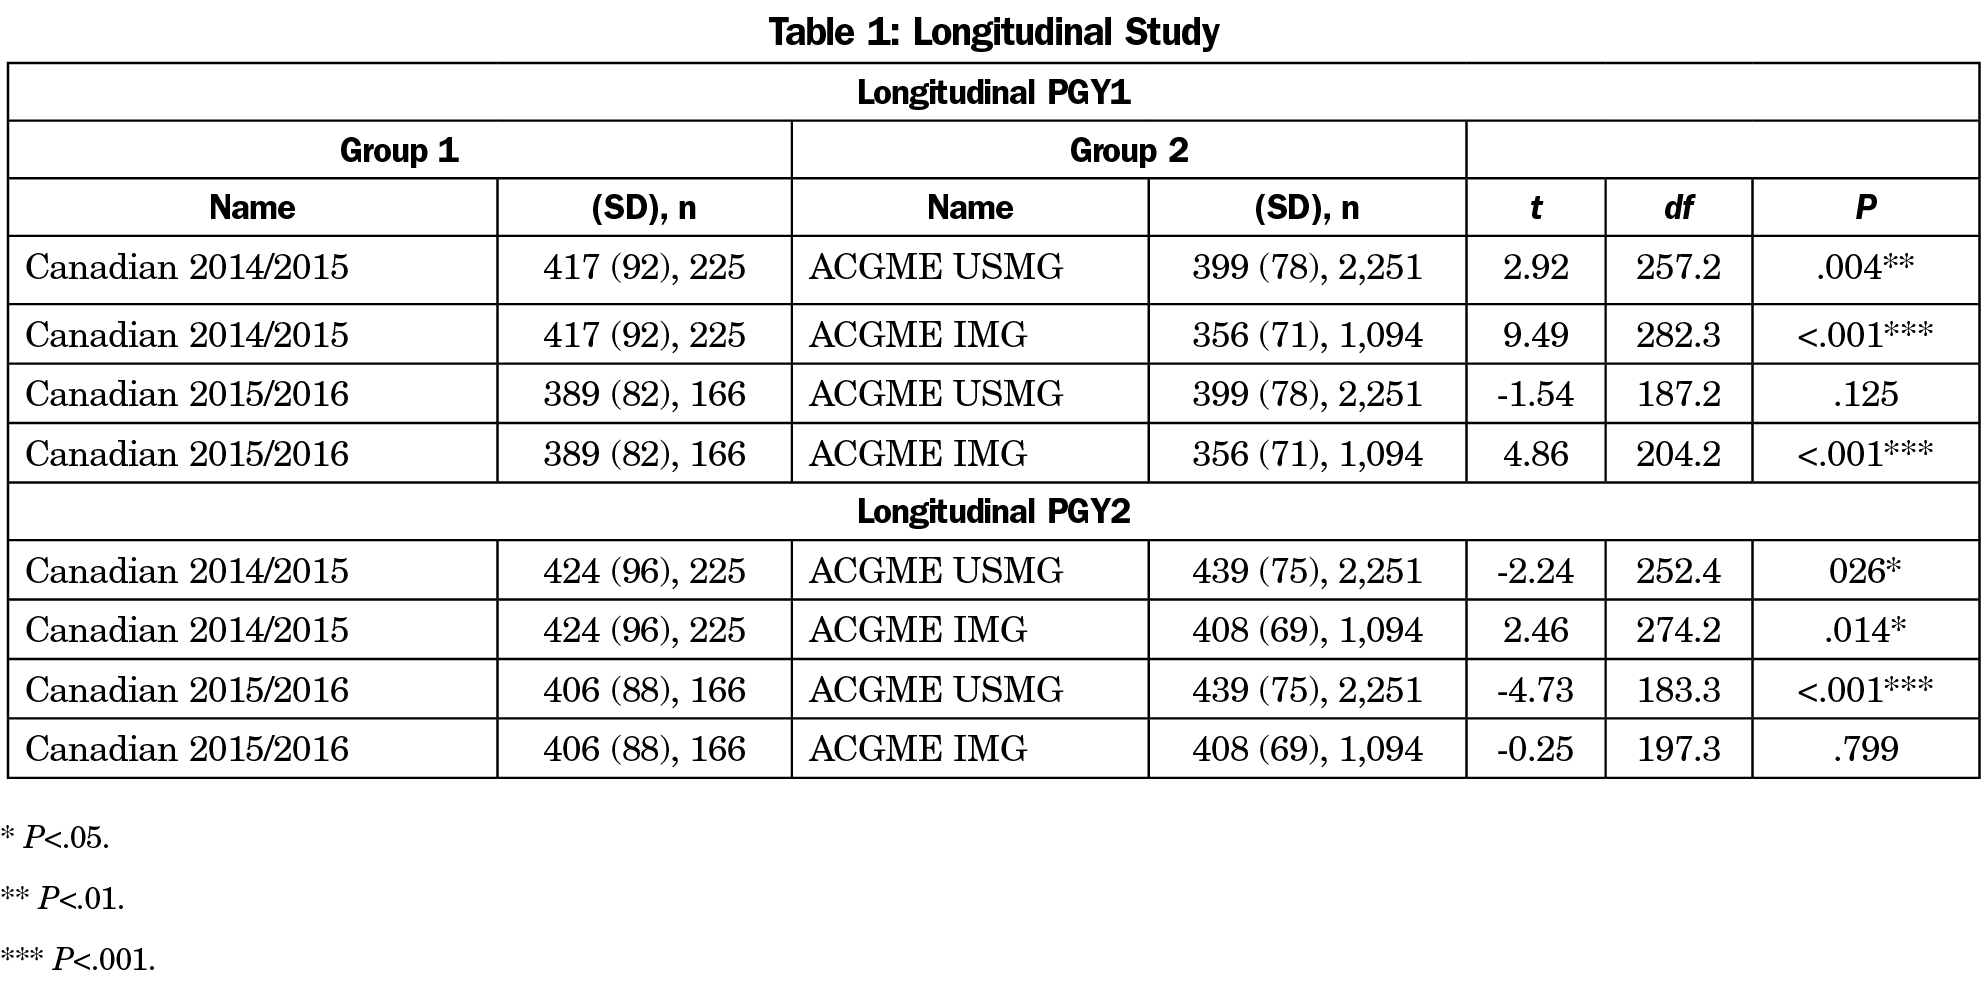
Since the Canadian residency programs are only 2 years in duration, we were able to construct two cohorts across the 3 years: Canadian 2014/2015 and Canadian 2015/2016. The results across each cohort for PGY1 are shown in Table 1. The Canadian 2014/2015 cohort (x̄=417, SD=92) showed significantly higher mean than the USMG cohort (x̄=399, SD=78, P=.004), and the IMG cohort (x̄=356, SD=71, P<.001). The Canadian 2015/2016 cohort (x̄=389, SD=82) showed no statistical difference from the USMG cohort (x̄=399, SD=78, P=.125), but did have significantly higher scores than the IMG cohort (x̄=356, SD=71, P<.001).
The results across each cohort for PGY2 are shown in Table 2. The Canadian 2014/2015 cohort (x̄=424, SD=96) showed significantly lower scores than the USMG cohort (x̄=439, SD=75, P=.026), but had significantly higher scores than the IMG cohort (x̄=356, SD=71, P<.001). The Canadian 2015/2016 cohort (x̄=406, SD=88) showed statistically lower scores than the USMG cohort (x̄=439, SD=75, P<.001) and no difference compared to the IMG cohort (x̄=408, SD=69, P=.799).
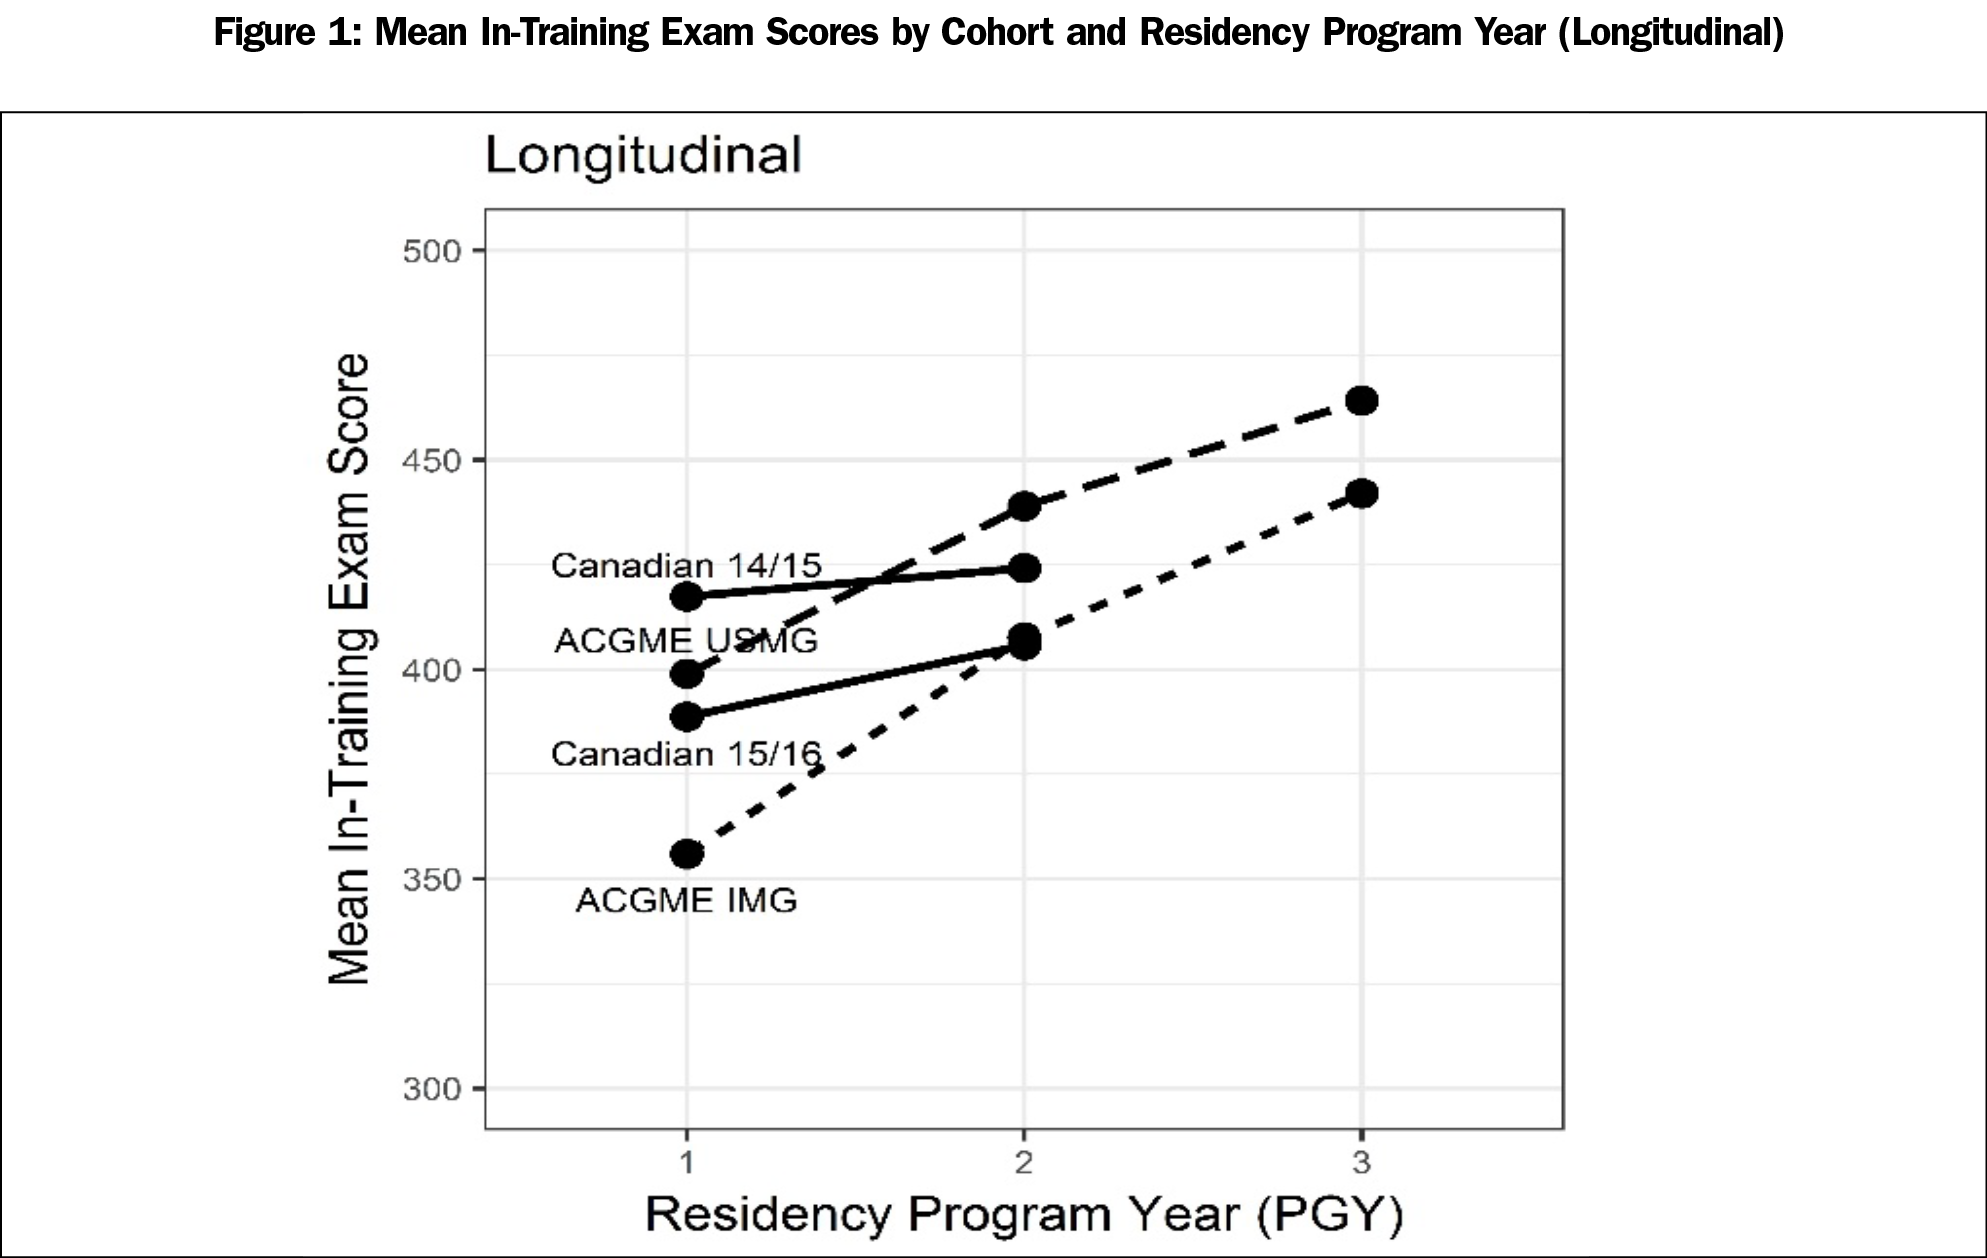
The mean growth for USMG and IMG is similar across the 3 years (Figure 1). Though the mean of IMG is much lower (x̄=356, SD=71) than that of USMG in 2014 (x̄=399, SD=78), the growth trend between 2014 and 2015 is almost parallel. When it comes to the year between 2015 and 2016, although the growth is comparatively lower for USMG (x̄=439, SD=75) than for IMG (x̄=408, SD=69), the growth trend is not significantly different from IMG.
Cross-sectional Comparisons of PGY-1 ITE Performance Across Years
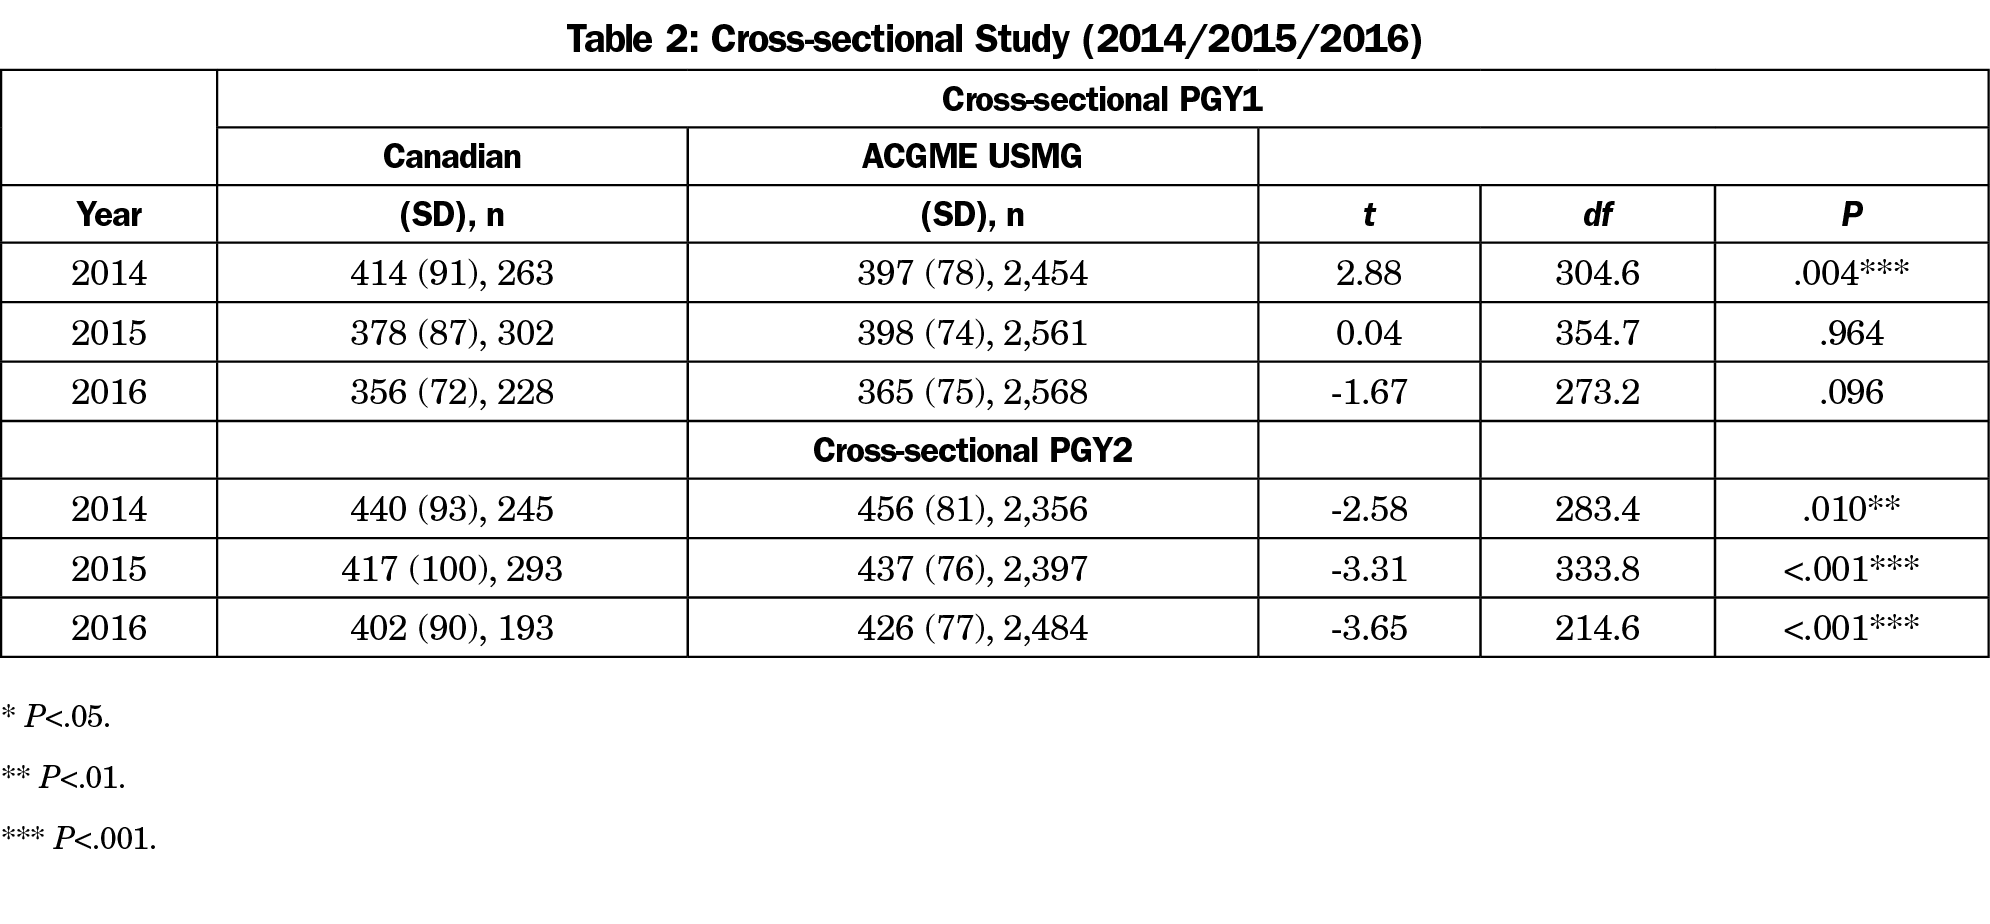
Examining the hypothesis that Canadian residents are better prepared at entry into residency, Table 3 shows that the 2014 PGY-1 Canadian cohort (x̄=414, SD=91) had a significantly higher mean scaled score than the USMG cohort (x̄=397, SD=78, P=.004). For 2015, the mean of the PGY-1 Canadian cohort (x̄=378, SD=87) was not statistically significantly different from the USMG cohort (x̄=378, SD=78, P=.964). Similarly, in 2016 the Canadian PGY-1 cohort (x̄=356, SD=72) again was not statistically significantly different from the USMG cohort either (x̄=365, SD=75, P=.096).
Cross-sectional Comparisons of PGY-2 ITE Performance Across Years
Examining the relative scores following 1 year of residency training, Table 2 shows that the 2014 PGY-2 Canadian cohort (x̄=440, SD=93) had a significantly lower score than the USMG (x̄=456, SD=81, P=.010). For 2015, the PGY-2 Canadian cohort (x̄=417, SD=100) again had significantly lower scores than the USMG (x̄=437, SD=76, P<.001). For 2016 the PGY-2 Canadian cohort (x̄=402, SD=90) also had significantly lower scores than the USMG cohort (x̄=426, SD=77, P<.001). A cross-sectional look at all 3 years from 2014 to 2016 have shown the PGY-2 Canadian cohort performing less well than the USMG cohort. These results are also shown in Figure 1.
Comparing the Representativeness of the Canadian Cohorts
Figure 1 shows the mean scores of each cohort throughout residency longitudinally. The relative performance of Canadian 2014/2015 and Canadian 2015/2016 begs the question of whether these two samples are both representative of the population. Table 3 shows that for PGY1, the scores for the Canadian 2014/2015 cohort (x̄=417, SD=92) was significantly higher than those for the Canadian 2015/2016 cohort (x̄=389, SD=82, P<.001). For PGY2, the score for the Canadian 2014/2015 cohort (x̄=424, SD=96) was again significantly higher than those for the Canadian 2015/2016 cohort (x̄=406, SD=88, P=.050).
The results for the current longitudinal study largely mirror those of the original cross-sectional study.9 The Canadian 2014/2015 cohort outperformed the USMGs in PGY1 upon entry to the program, but gradually performed at the similar rate in PGY2. The Canadian 2015/2016 cohort was not significantly higher or lower than the ACGME USMGs in PGY1, but the performance of the Canadian 2015/2016 cohort was much lower compared to that for ACGME USMG in PGY2. In general, the Canadian cohorts performed as well or better upon entry, but at a less appreciable rate in their second year (Table 1, Figure 1).
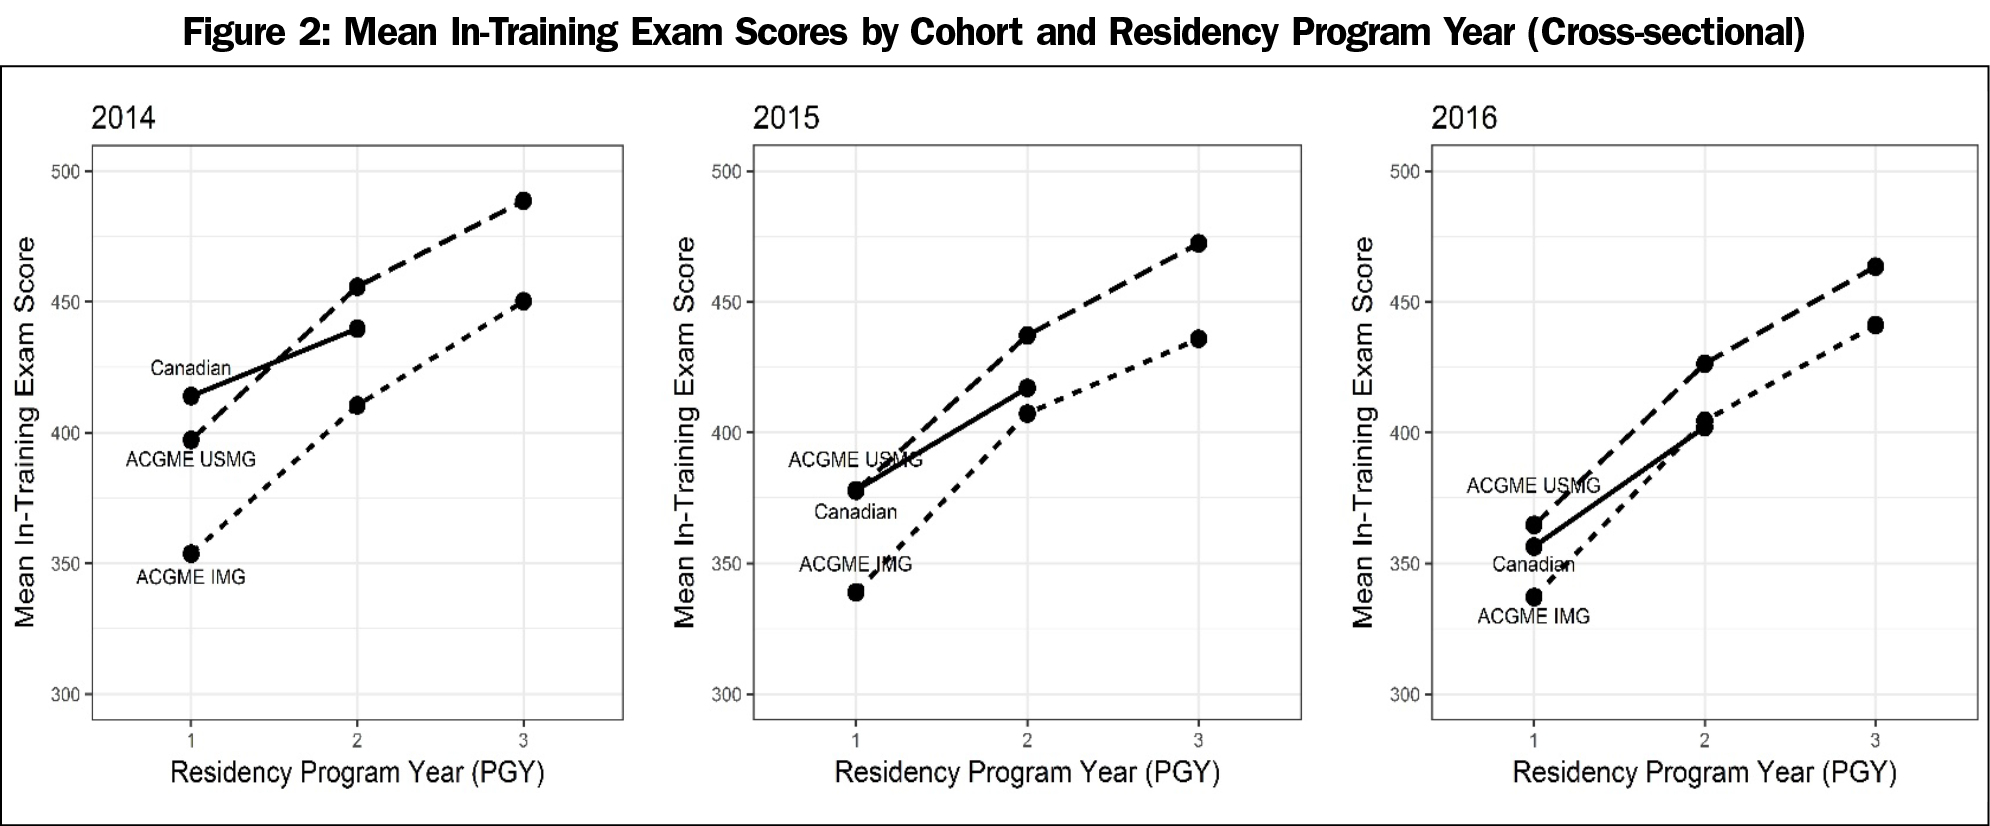
Taking a cross-sectional view of the data, it shows that in PGY1 for 2014, Canadians performed better than USMGs, but for 2015 and 2016, the Canadian cohorts were not different from the USMG. This result is in line with the previous findings that the first year’s Canadian residents perform the same or better than their US counterparts. For PGY2, the cross-sectional analysis showed that the Canadian cohorts performed comparably lower than the USMGs across all 3 years (Table 2, Figure 2).
Additionally, given that a significant difference was found between the performance of Canadian 2014/2015 and Canadian 2015/2016 cohorts (Table 3), it is natural to ask whether these two samples are both representative of the population of Canadian residents. Unfortunately, we are unable to make this determination since we don’t have ITE scores for all Canadian residents. However, it does seem that there is a difference between the two Canadian cohorts, which raises questions about a potential selection bias based on which Canadian residency programs choose to take the ABFM ITE.
The current longitudinal study had several benefits. Firstly, it allowed the researchers in the related areas to look at the comparison on the 3 years in US programs and 2 years in Canadian programs and helped them gain an understanding of where the changes were and where there was stability. Secondly, a larger data set, the longitudinal study was a more accurate and reliable estimation of the whole research population over the cross-sectional comparison.
The previous finding that improvement in ITE scores for the ACGME-accredited residency programs were independent of the location of undergraduate medical training was also supported in the longitudinal study. The two parallel lines found in the longitudinal data (Figure 1), as well as the three cross-sectional cohorts (Figure 2), support this conclusion. The USMGs and IMGs had similar growth throughout the 3 years, which indicated that there was no significant difference in their knowledge performance based on where the test was taken. It was an indication of the equity feature of the accredited residency programs. What we could speculate was that curricular differences between Canadian and ACGME residency programs accounted for the differences in performance seen between the first and second program years.
This study has limitations. Primarily, the Canadian residency programs may not have been fully representative of the population of Canadian residents. Unfortunately, the relatively small sample size limits our ability to generalize to the entire population of Canadian residents. Additionally, the Canadian programs that participate in the ABFM’s ITE change each year, with some new programs entering and some programs dropping out. Fluctuations in these cohorts may have impacted our results. Furthermore, the difference existing in the test content and psychometric performance of the tests themselves could bring bias to the study; the lower scores may be a marker of deficits in residency preparation of training, when this may have been related to the test structure and comparison itself. There remains a lack of detailed comparison of the USMG and IMG cohorts throughout the years; such a comparison would be worthwhile.
Acknowledgments
Conflicts of Interest: Drs Peabody and O’Neill and are employees of American Board of Family Medicine (ABFM). This research was conducted while Rongxiu Wu and Xian Wu were interns at the ABFM.
Presentation: This study was presented at the American Educational Research Association Annual Meeting in New York, NY, April, 2018.
References
- Phillips WR, Haynes DG. The domain of family practice: scope, role, and function. Fam Med. 2001;33(4):273-277.
- Good Stewardship Working Committee. The ‘top 5’ lists in primary care: meeting the responsibility of professionalism. Arch of Int Med. 2011;171(15):1385-1390. https://doi.org/10.1001/archinternmed.2011.231
- The Association of Faculties of Medicine of Canada. The future of Medical Education in Canada: A Collective Vision for MD Education’. Ottawa, ON, Canada: Association of Faculties of Medicine of Canada; 2015.
- Hutten-Czapski P, Pitblado R, Slade S. Short report: scope of family practice in rural and urban settings. Can Fam Physician. 2004;50:1548-1550.
- Chase SM, Miller WL, Shaw E, Looney A, Crabtree BF. Meeting the challenge of practice quality improvement: a study of seven family medicine residency training practices. Acad Med. 2011;86(12):1583-1589. https://doi.org/10.1097/ACM.0b013e31823674fa
- O’Neill TR, Peabody MR, Puffer JC. Differences in Canadian and US Medical Student Preparation for Family Medicine. Fam Med. 2016;48(10):770-774.
- Wright BD, Panchapakesan N. A procedure for sample-free item analysis. Educ Psychol Meas. 1969;29(1):23-48. https://doi.org/10.1177/001316446902900102
- Rasch G. Studies in mathematical psychology: I. Probabilistic models for some intelligence and attainment tests. Oxford, UK: Nielsen & Lydiche; 1960.
- Canadian Resident Matching Service. Table 17 in: Match results for CMGs by discipline preference. Ottawa, ON: Canadian Resident Matching Service, 2014.


There are no comments for this article.