Background and Objective: Evaluating the time taken at each step in a patient office visit is important for physicians and clinical staff for clinic workflow improvements. Very little data exists on efficiency that is not self-reported by physicians. Employees often have perceptions of the efficiency of a clinic without supporting data. This study examined whether employee perceptions of the amount of patient time spent at various points in the visit matched observed times.
Methods: Observational cohort study methods and a cross-sectional survey were used in the fall of 2017 in a family practice residency outpatient clinic. Clinical staff (physicians and support staff) were surveyed for their perceptions of patients' time spent at each checkpoint in an office visit. A total of 885 visits were recorded, with 705 being included after review. Time spent at various steps, appointment type, and clinician years of experience were assessed with t-test for statistical significance.
Results: The anonymous clinic survey had a 75.5% response rate (37/49) and showed "rooming patients" and "waiting in the exam room to be seen" were the two areas that took longer than expected. The observed data confirmed this perception, showing that rooming and waiting in the exam room each took longer than the staff expected. These values were also greater than available national average times. There was a significant correlation between physician training year and visit length. There was no correlation for nursing experience and patient visit times.
Conclusions: The staff-perceived inefficiencies correlated with observed inefficiencies. Addressing these problems would improve patient care and overall clinic workflow.
Effective workflow management is essential in a patient-centered primary care setting. In many cases, physician reimbursement is dependent on both patient care efficiency and satisfaction.1 Effective workflow interventions reduce clinician burnout, while also improving satisfaction.2 Staff perceptions concerning the office workflow can have a negative effect on morale.3 Understanding how staff perceptions match up with actual inefficiencies is an important aspect in improving the office’s overall atmosphere.
Patients have reported increased satisfaction with their visit when the time they spend with the physician meets or exceeds their expectations.4,5 Almost no published data exist showing how much time a patient spends at each stage of the appointment or where delays occur over the course of a primary care visit. The data that does exist is primarily self-reported by physicians. Data from physicians’ self-reporting may be missing valuable variables such as overall office flow and door-to-door times and is subject to reporter bias.6 One aspect of practice management is understanding how physician and staff experience affect the overall workflow of the office, including office setup, electronic medical records, and other regulations.7,8
Our family medicine residency program includes practice management training as part of the curriculum, and that didactic exposure to the workflow side of outpatient care led to the development of this project.
This project was performed in a family medicine residency’s outpatient clinic. The clinic is a patient-centered medical home (PCMH). Institutional Review Board approval was obtained for this study from Lutheran Health Network (LHN# 16-457).
The investigators developed two tools for this project. The first was a free response survey for all clinic employees (eg, front desk, nursing, etc), residents, and attending physicians of the Family Medicine Center (FMC). All responses were anonymous to promote participants’ response veracity regarding patient appointment’s workflow in the fall of 2016. For the survey, appointments were broken down into stages: time in the waiting room, being roomed by nursing, waiting to be seen by the physician, time with the physician, waiting to check out, and checking out. The survey asked the staff to write in a time, in minutes, that they believed was acceptable for patients to be spending at each stage in the appointment. It also asked the participants to mark down if they felt FMC patients were spending too little, too much, or an appropriate amount of time at each of the stages.
The second tool was a paper patient tracking tool that went with the patient’s chart since the FMC’s electronic medical record does not track patient time data. It was developed by the investigators and listed the appointment stages described above with spaces to record the beginning and ending time of each stage. The beginning and ending time of each stage was recorded by the clinic staff. This tool was validated with a 2-day trial run period utilizing only the investigators’ patients, and then subsequently distributed clinic wide. A total of 705/885 appointments were observed over 10 business days in the FMC. In addition to the patient time data, type of visit and physician years of experience were recorded for each appointment. Using the t-test, the visit average times were compared to the staff survey’s average times and also to available national averages.9,10
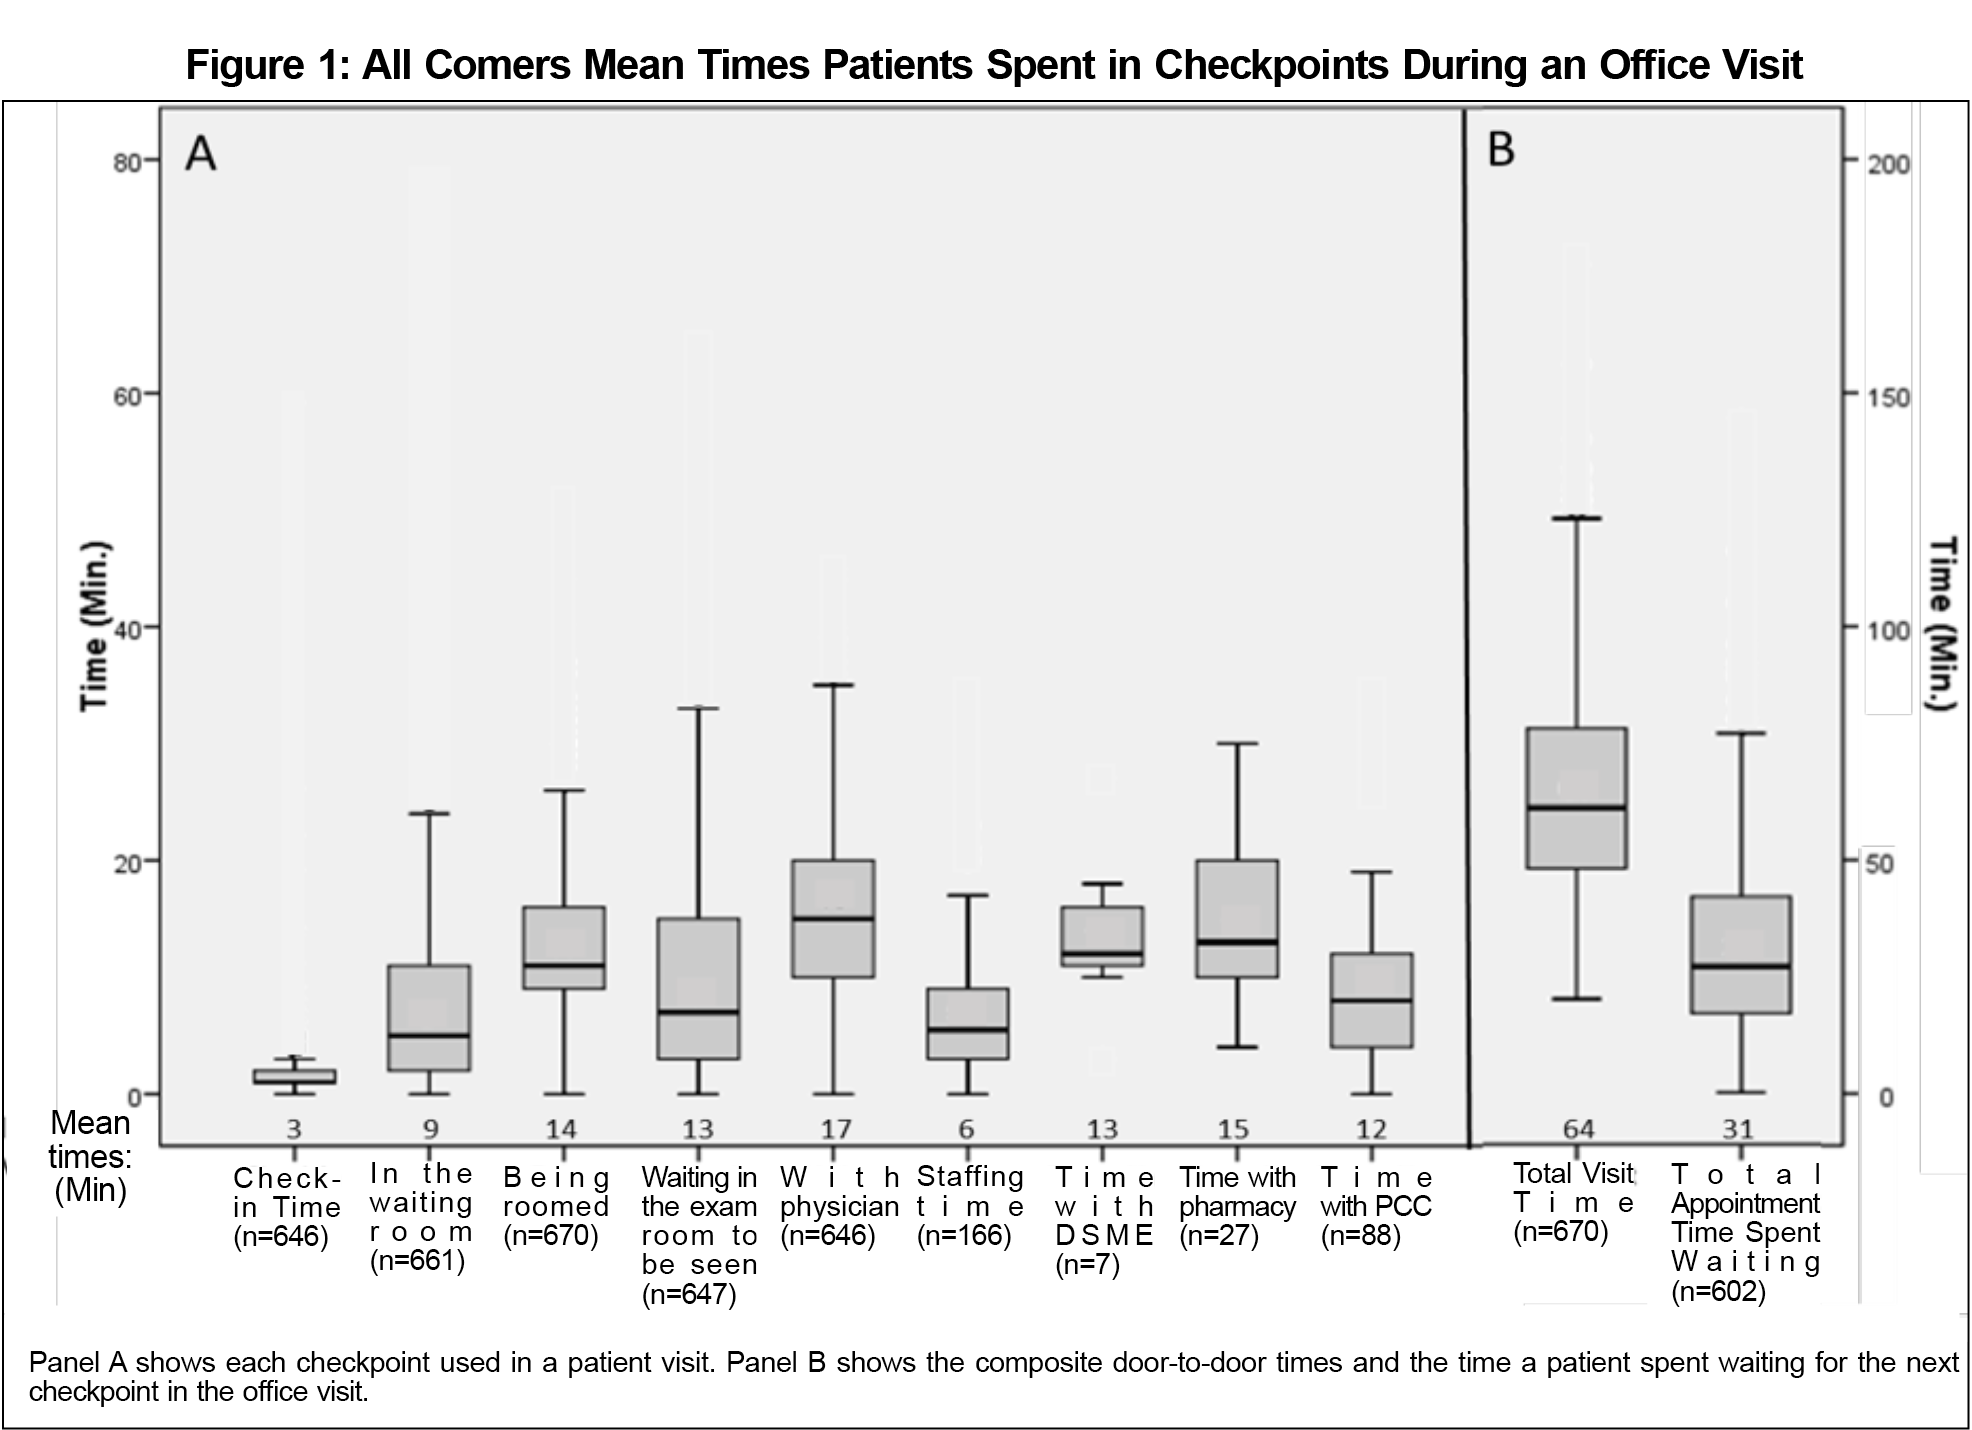
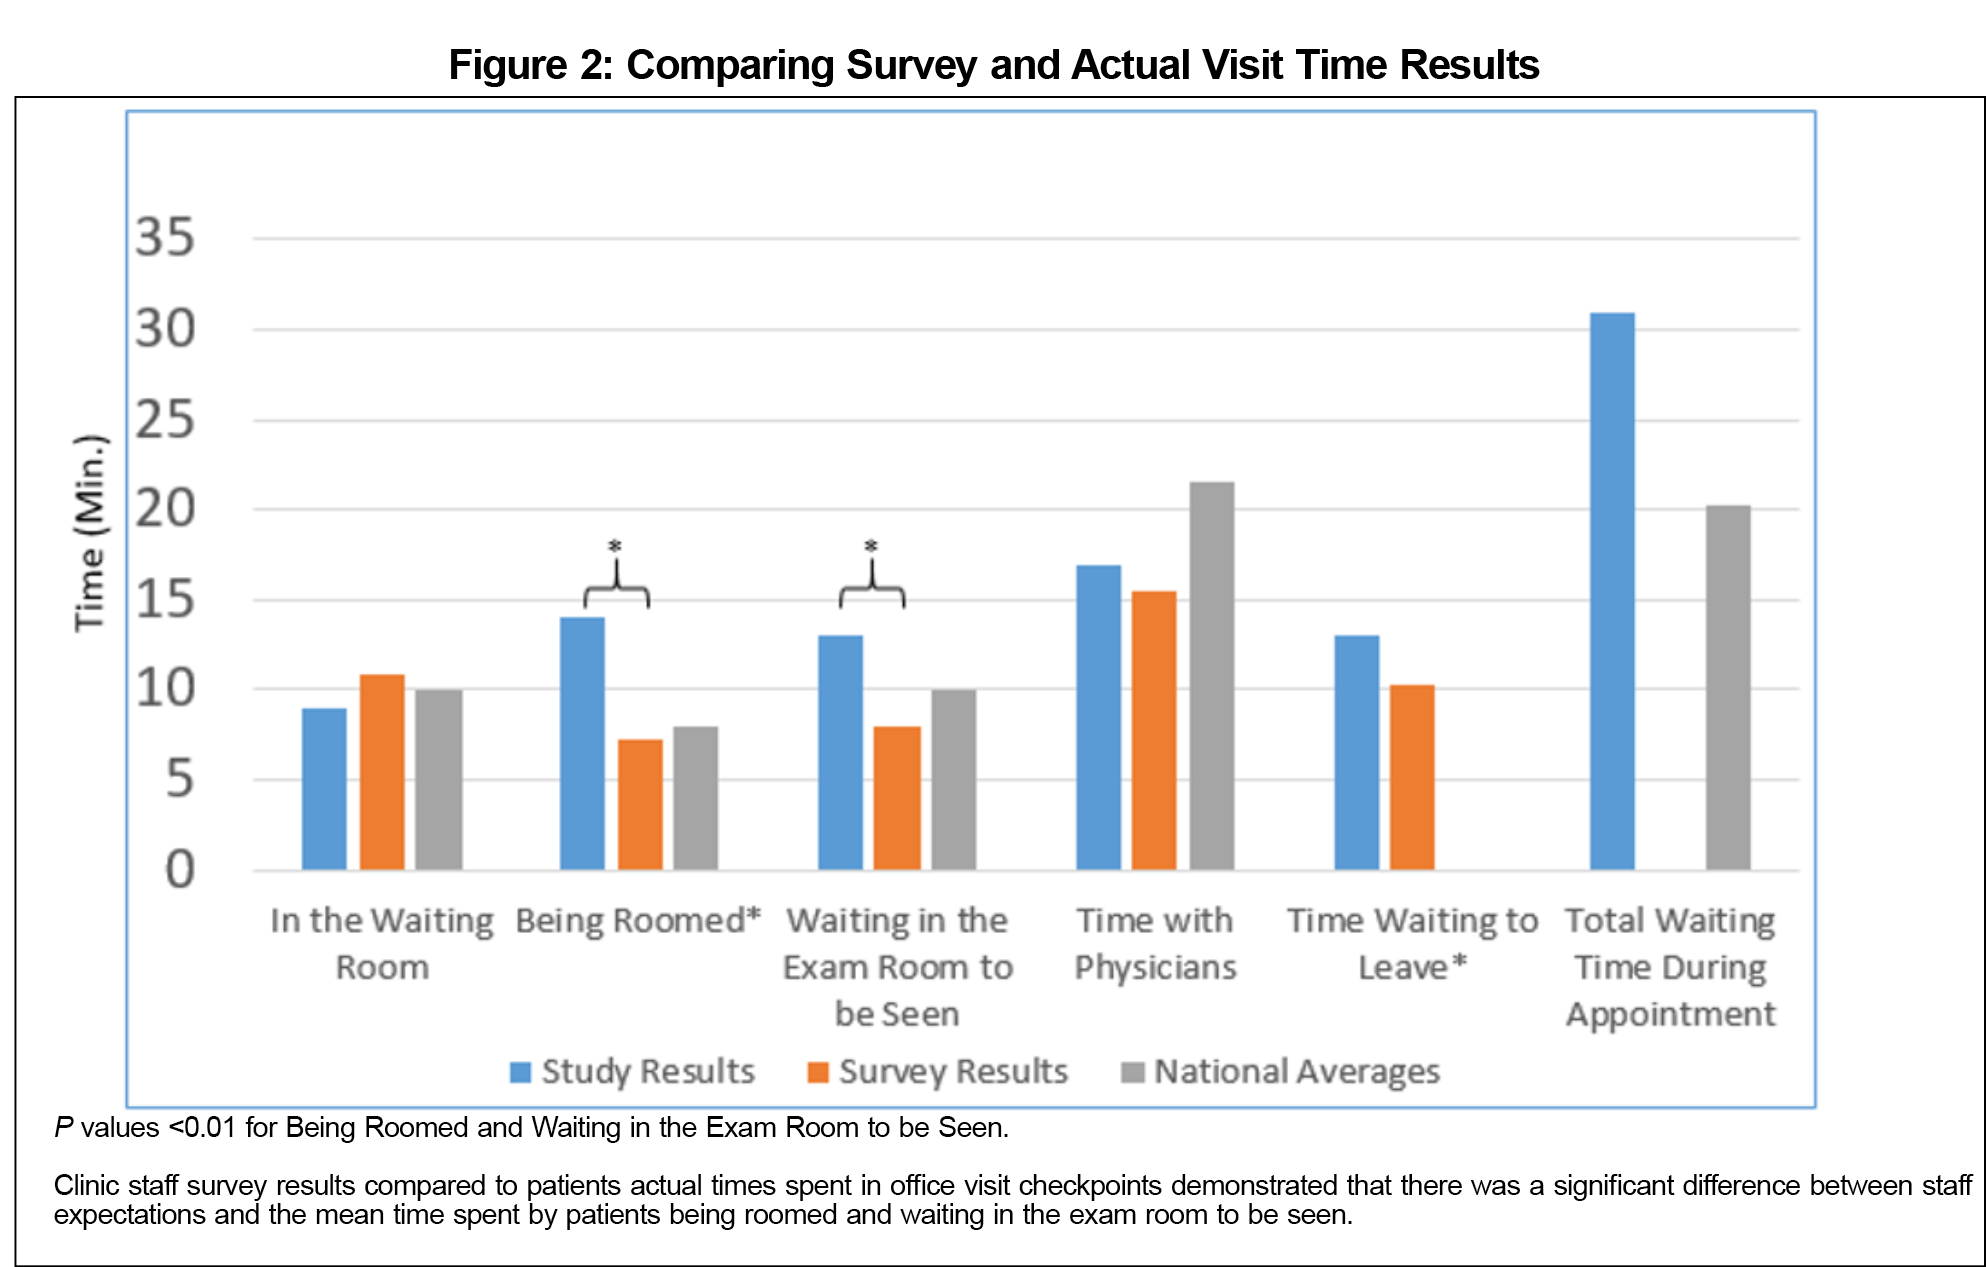
The cross-sectional anonymous clinic staff survey had a 75.5% response rate (n=37). The results demonstrated that the majority of staff believed “rooming patients” and “waiting in the exam room to be seen” were the two stages of a visit that took longer than they should (Table 1). In all other categories, the majority of staff believed that the visit stages were taking an appropriate amount of time. In the survey, the staff stated that it should take an average of 7.24 minutes to room a patient and 7.97 minutes waiting in the exam room to be seen. Figure 1 shows that the median times for many of the stages of the appointment were acceptable when compared to available data. Data points that were two or more standard deviations from the mean have been omitted from Figure 1 for clarity, but were still included in the calculation of both the mean and interquartile ranges. Time data also showed that patients spent an average of 14 minutes being roomed (n=670) and 13 minutes waiting in the exam room to be seen (n=647). These values were both significantly longer than the expected values of 7.24 and 7.97 minutes (P<0.01). The times for these two stages were also longer than the national average (Figure 2). Finally, the mean door-to-door visit time was 64 minutes, with 31 minutes spent waiting (n=602). The mean total time spent by patients waiting was higher than the national average of 20.25 minutes.9
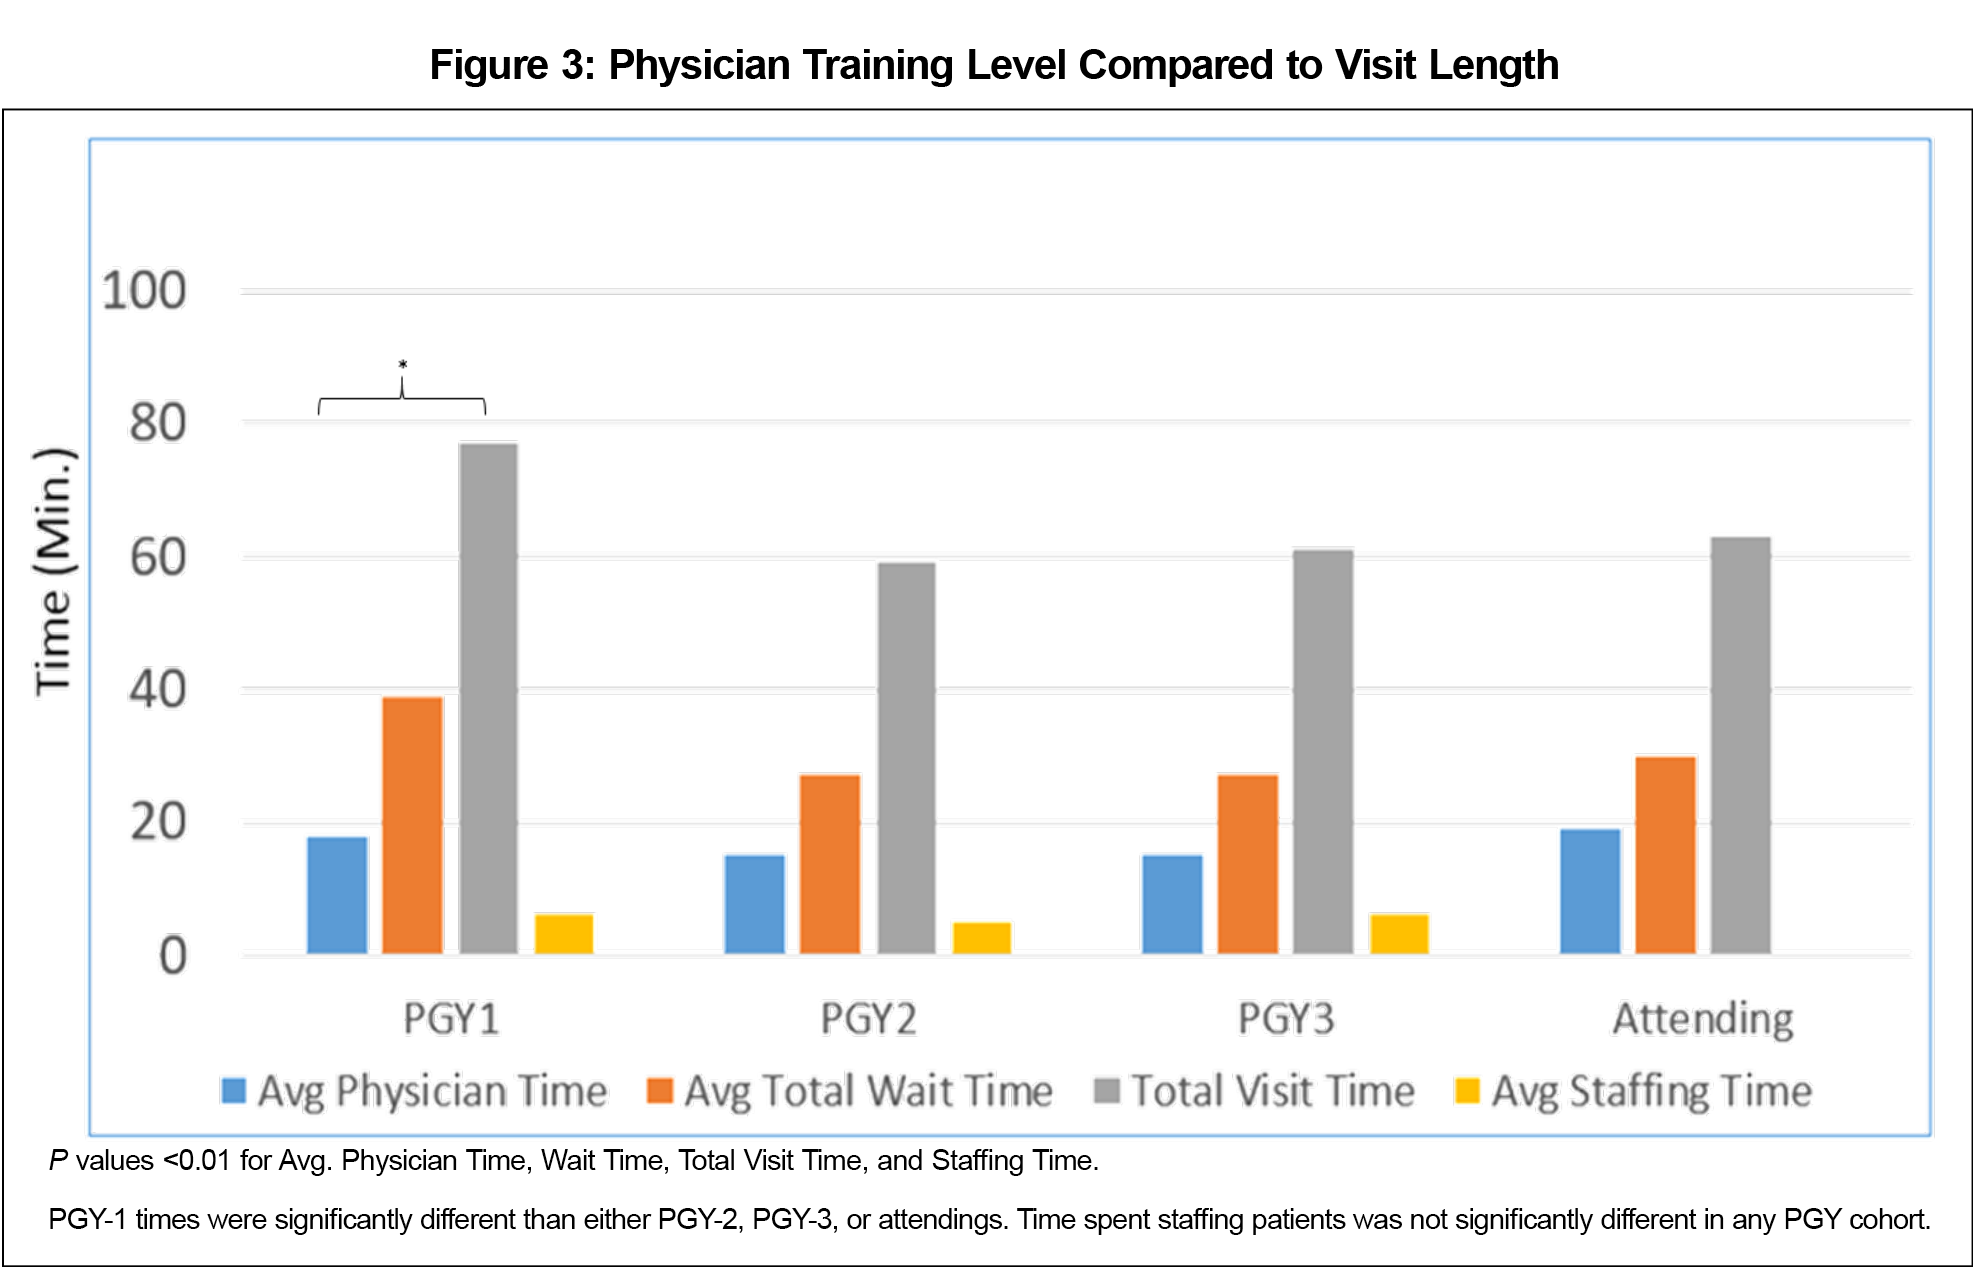
The visit-type data showed that new patients had rooming times of 21 minutes, which is significantly longer than the expected time (P<0.01). New patients had a significantly longer total visit time than the national average (P<0.01). Well exams, follow-ups, same-day, and other appointments all also had longer average visit times. Overall, there was a significant correlation found between visit type and the subsequent visit length, rooming time, and physician time. There was no significant correlation found between years of nurse experience and average rooming time or visit length, however there was a significant correlation found between physician training year and visit length (Figure 3).
Discussion and Conclusions
The clinical staff survey asked participants to write in the staff perception box how many minutes they felt patients were spending at each stage of an appointment. They then circled if they felt that the time being spent by the patient at each stage was too short, too long, or about right. The time points from 705 patient visits were collected and analyzed. It was evident from the graph that median times for the majority of visit stages compared well to available national data (Figure 1).
There were three main system issues identified over the course of this project. First, providers work with different nurses each week, due to the number of providers (34 residents and six physician faculty) in the clinic, and are only in clinic a maximum of 2 days a week. Since each provider has their own style, the encounters are not as quick as a nurse-physician team that works together daily. Resolving this scheduling concern is an intervention we intend to implement in future work. Second, 85% of the patient panel in the FMC is either Medicare or Medicaid, a fact which which commonly creates a complex patient encounter leading to physicians and nurses having to coordinate the needs with other in-house services (eg, pharmacy, behavioral health, social workers, etc). Finally, our organization is pursuing a federally qualified health center status, so there are increased data collection requirements that have been placed on the nurses.
In addition to the system issues identified from this study, other time considerations were assessed. The authors were surprised that the majority of respondents felt that the time our physicians spend with a patient was “about right” when they indicated an average of 15.5 minutes for a 20-minute appointment slot. We expected that response to be “too short,” since the physicians weren’t on average using the full 20 minutes allotted for the patient’s visit. The PGY-1 residents taking longer than their peers to complete a patient visit was unsurprising. Anecdotally, they take additional time with attending physicians to staff patients, engage in more teachable moments, and are still polishing their interactions with patients. Since nurse experience was not a factor in the time each stage took, there must be a system issue of too many tasks or tasks being too complex for the rooming to be completed in a timely manner. Staff awareness of the inefficiency points in a patient encounter is a positive finding of this study. Interventions can be focused on these areas rather than first having to identify where the problems lie and then work on developing interventions. Lastly, one limitation to these results is the lack of clear comparator clinics in the literature. As a PCMH residency training clinic, our time points may not be directly comparable to a traditional established outpatient clinic, so appointment times may necessarily differ compared to national averages.
There were notable limitations to this study. The paper patient tracking system that was used had numerous incomplete recordings, leading to results that are incongruous with the reality of patient encounters (eg, 0 minutes spent) leading to this data being excluded from the analysis. An electronic tracking system with time stamps would have helped mitigate the human error associated with the paper tracking system and would have been more effective at providing accurate time data. Also, there was a lack of available literature to compare the workflow results with other similar settings. To the best of the authors’ knowledge, very few studies exist that have examined the workflow of a residency-based PCMH outpatient primary care office. It was difficult to find national average data for many of the patient visit categories included in this study. Finally, there was also a variance in patient complexity that was not evident from the visit type (ie, one chief complaint compared to managing multiple comorbidities in an office visit).
In conclusion, this study demonstrated that there was a correlation between the clinic staff’s perception of workflow inefficiencies and actual inefficiencies in a primary care setting. The reasons for patient stages taking longer than expected were not attributable to nurse experience and indicated infrastructure and system issues that need to be investigated in future studies.
Acknowledgments
This project was presented at the Indiana Association of Family Practice Research Day, May 11, 2017, Carmel, IN, as a resident podium presentation.
References
- Centers for Medicare and Medicaid Services. MACRA. www.cms.gov/Medicare/Quality-Initiatives-Patient-Assessment-Instruments/Value-Based-Programs/MACRA-MIPS-and-APMS/MACRA-MIPS-and-APMs.html. Accessed September 6, 2017.
- Linzer M, Poplau S, Grossman E, et al. A cluster randomized trial of interventions to improve work conditions and clinician burnout in primary care: results from the Healthy Work Place (HWP) Study. J Gen Intern Med. 2015;30(8):1105-1111. https://doi.org/10.1007/s11606-015-3235-4
- Priebe S, Fakhoury WKH, Hoffmann K, Powell RA. Morale and job perception of community mental health professionals in Berlin and London. Soc Psychiatry Psychiatr Epidemiol. 2005;40(3):223-232. https://doi.org/10.1007/s00127-005-0880-7
- Lin CT, Albertson GA, Schilling LM, et al. Is patients’ perception of time spent with the physician a determinant of ambulatory patient satisfaction? Arch Intern Med. 2001;161(11):1437-1442. https://doi.org/10.1001/archinte.161.11.1437
- Bestvater D, Dunn EV, Townsend C, Nelson W. Satisfaction and wait time of patients visiting a family practice clinic. Can Fam Physician. 1988;34:67-70.
- Shaw MK, Davis SA, Fleischer AB Jr, Feldman SR. The duration of office visits in the United States, 1993 to 2010. Am J Manag Care. 2014;20(10):820-826.
- Holroyd-Leduc JM, Lorenzetti D, Straus SE, Sykes L, Quan H. The impact of the electronic medical record on structure, process, and outcomes within primary care: a systematic review of the evidence. J Am Med Inform Assoc. 2011;18(6):732-737. https://doi.org/10.1136/amiajnl-2010-000019
- Ahn TS, Park IS, You OS, Shin HJ, Woo KS, Jo EM. Nurses’ perceptions of and attitudes toward an electronic medical record system at Seoul National University Hospital. Stud Health Technol Inform. 2006;122:851.
- Medical Group Management Association. MGMA 2016 Practice Operations Report: Based on 2015 Survey Data. Englewood, CO: Medical Group Management Association; 2016.
- Woodstock EW. Mastering Patient Flow.4th ed. Englewood, CO: Medical Group Management Association; 2014.