
Performing scientific research without falling victim to one of the many research design, analysis, and reporting pitfalls can be challenging. As a medical statistician with research experience in a variety of medical disciplines, I regularly come across (and sometimes have been the cause of) avoidable errors and inaccuracies. Without such errors, research would, at the very least, be more informative to the readership of the research manuscript. In this article I present a short, nonexhaustive list of issues to consider.
SPECIAL ARTICLE
A Very Short List of Common Pitfalls in Research Design, Data Analysis, and Reporting
Maarten van Smeden, PhD
PRiMER. 2022;6:26.
Published: 8/10/2022 | DOI: 10.22454/PRiMER.2022.511416
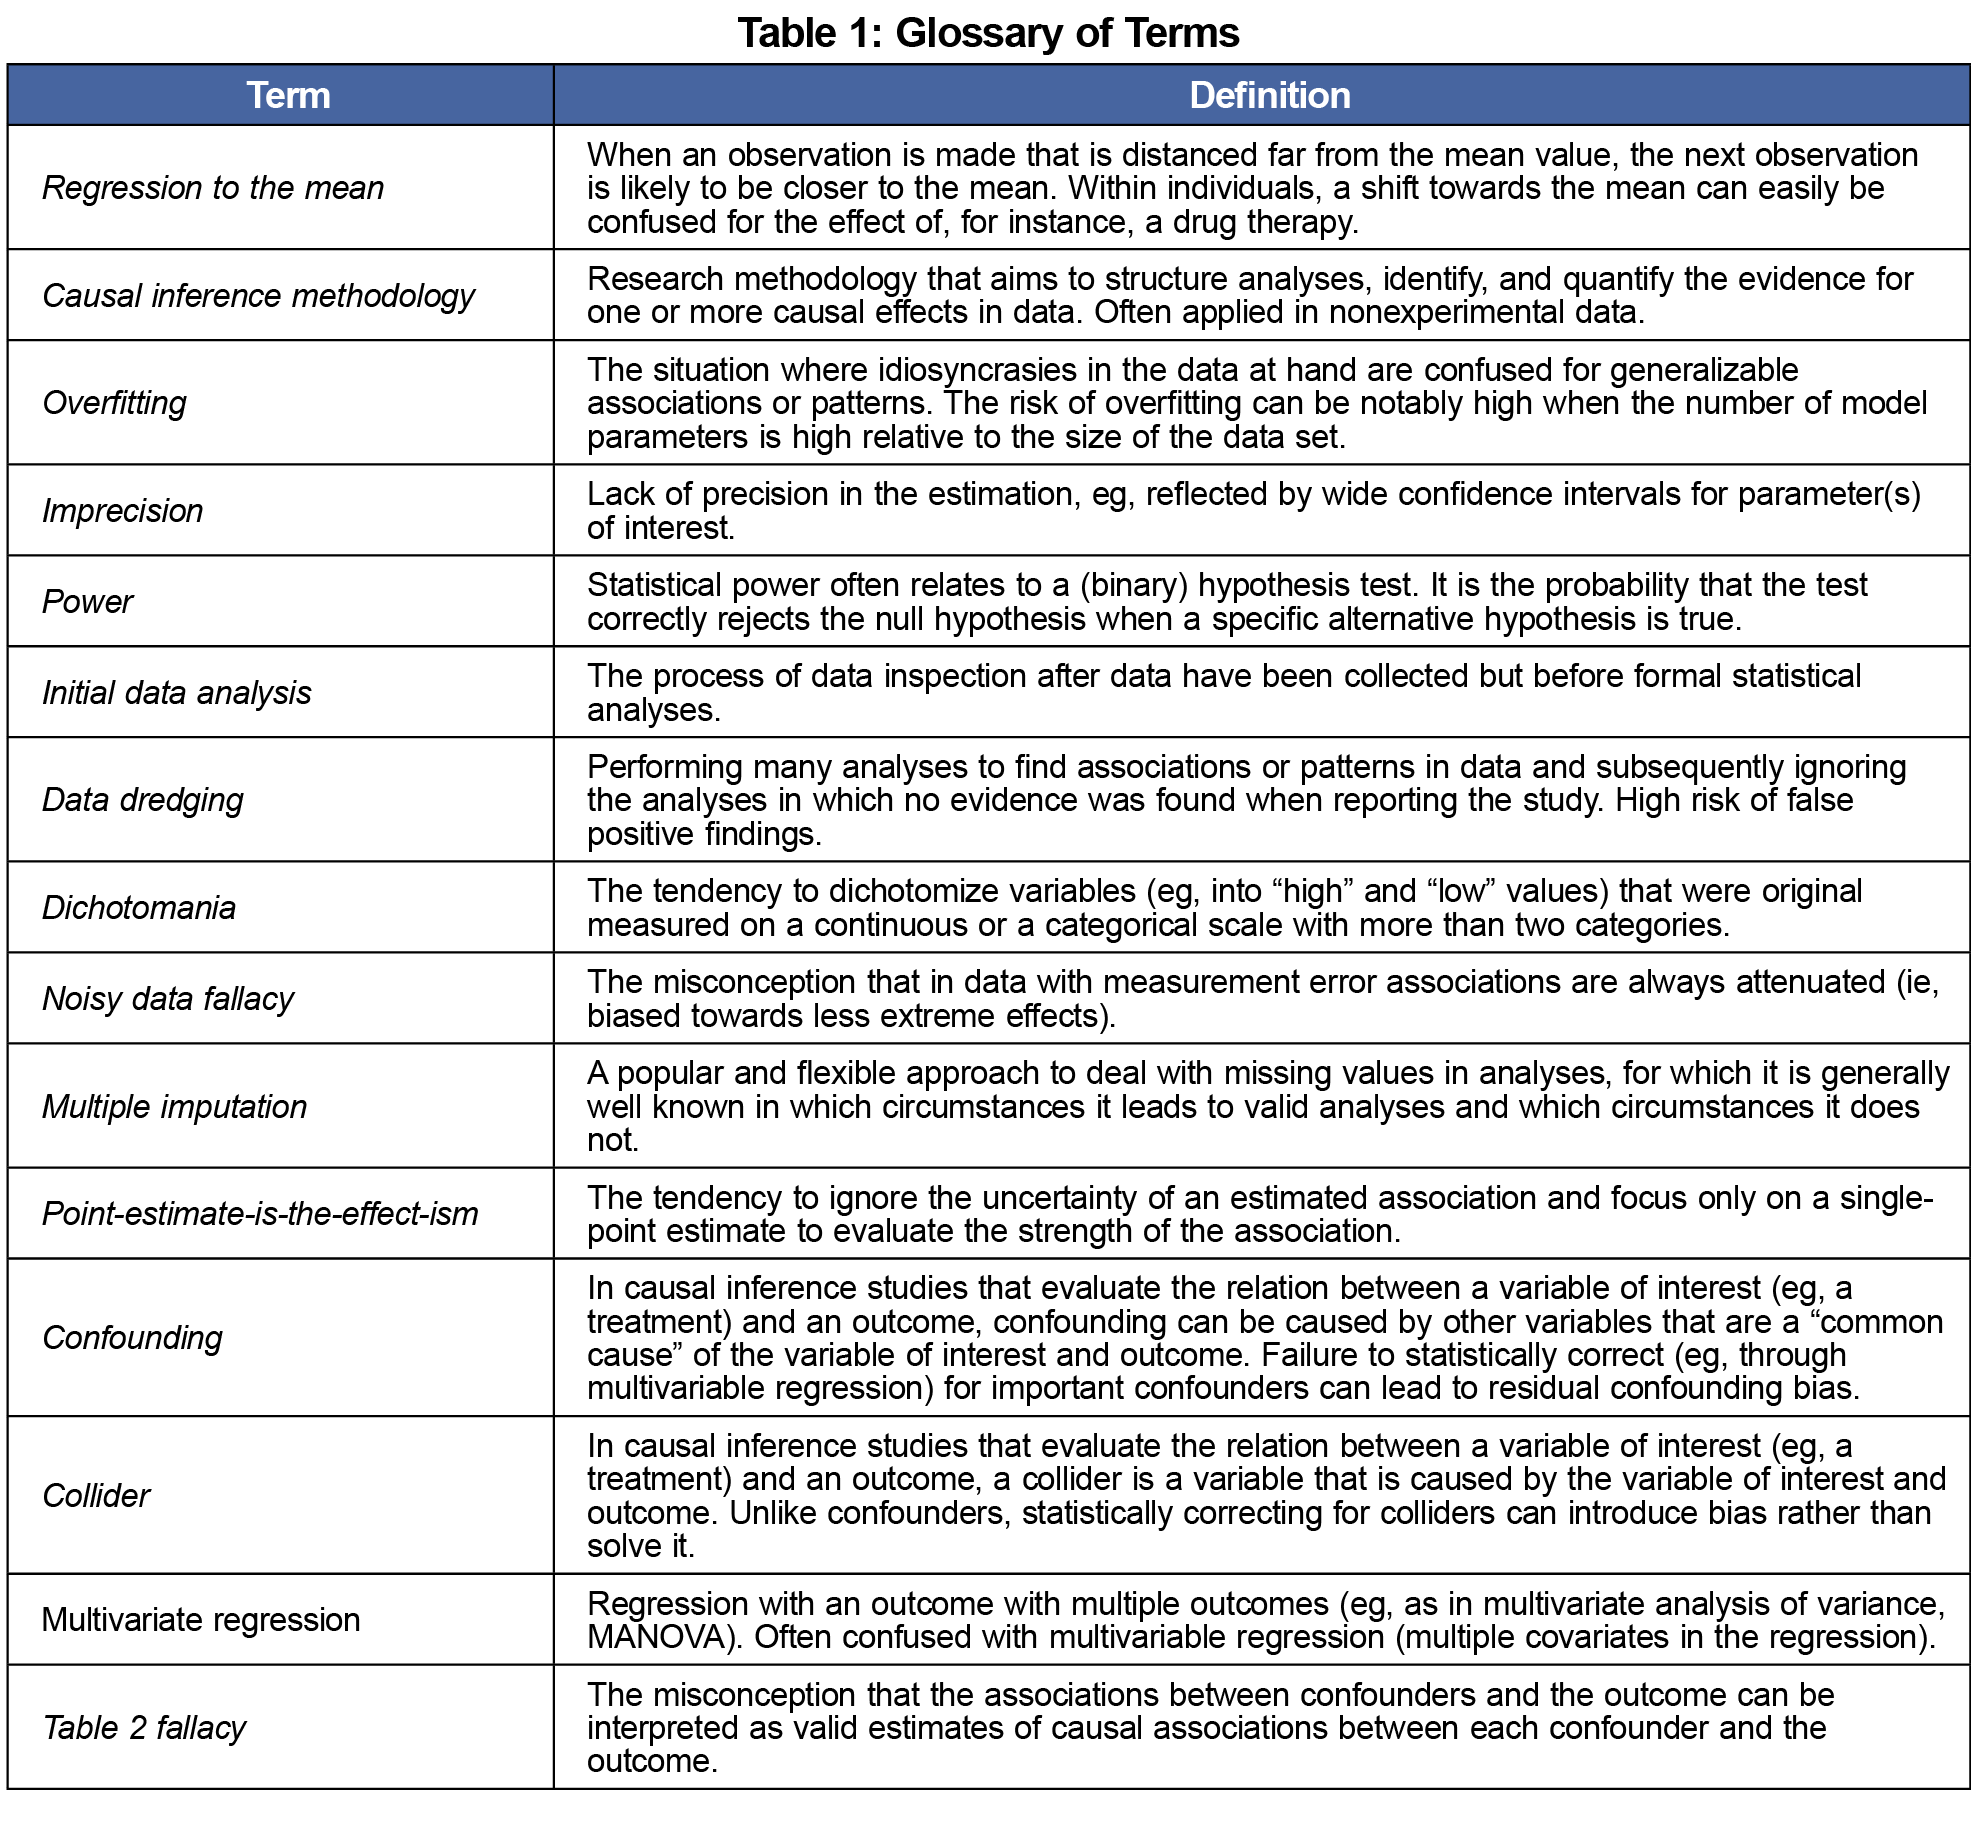
As the starting point of all scientific endeavors, it is incontrovertibly important to clearly define the research questions and aims. The subsequent planning of the collection of useful data and formulating adequate statistical analysis often becomes easier once it is clarified whether the ultimate aim is to predict, explain, or describe.1 If the ultimate aim is to explain, the ideal design is often an experiment (eg, a randomized controlled trial). Conversely, for many health-related research questions, nonexperimental data are the only viable source of information. This type of data is subject to factors that hamper our ability to distinguish between true causes of outcomes and mere correlations. For instance, for a nonexperimental before-after study, a change in the health for some individuals over time is easily mistaken as evidence for the effectiveness of a particular curative treatment, which may just be caused by regression to the mean.2 To avoid such errors, studies with an explanatory aim may benefit from applying causal inference methodology.3
A too-small-for-purpose sample size may result in overfitting,4 imprecision, and lack of power, which can ruin a study of any kind. It is worthwhile to calculate the minimal sample size required to avoid disappointment.5 It is usually wise to be skeptical about rules of thumb for sample size.6
After data have been collected and cleaned, and initial data analysis7 has been completed, it often requires a large amount of self-discipline to follow the a priori defined statistical analyses plan (if one is even available). Indeed, it is hard not to look at every potential association in any given data set and even harder to unsee what is possibly just a false positive once one has started data dredging.8
After data collection, some researchers seem to have the natural tendency to immediately dichotomize measurements that were originally measured on a continuous or ordinal scale, such as dichotomizing the age of patients into groups of young and old. This natural tendency to dichotomize, sometimes referred to as dichotomania,9 is very often a bad idea.10 Various approaches exist that allow for data to be analyzed and made insightful on a continuous scale.11
The presence of measurement and misclassification errors in data sets (present in most data sets, in my experience) are often wrongfully considered relatively unimportant.12 Some have even argued that only the strongest effects will be detected in data that contain measurement error.13 This misconception that only the strongest effects will survive, I call the noisy data fallacy. Many statistical approaches exist that account for measurement and misclassification errors.14
Likewise, some degree of missing data is almost unavoidable in any study. Methods to deal with missing data, such as multiple imputation,15 have been criticized for making strong, untestable assumptions. While this is true, what is easily forgotten is that the assumptions made when ignoring missing data are often even stronger.16
Data are also often clustered. That is, data are often obtained from multiple centers, multiple studies, or multiple measurements within the same individual (eg, time series). In these settings where some data are more alike than others, it is often important to adjust the analyses accordingly.17
While many readers are quick to point out that a statistically significant effect does not mean the effect is also large enough to be relevant, it seems easier to forget that effects that are not statistically significant may not carry strong evidence that the effect does not exist.18 Contrary to popular opinion, removing variables that are not statistically significant from the analysis may not improve interpretation19 and may increase the chances of overfitting.20
Given the many pitfalls in interpretation of P values and statistical (in)significance,21 some researchers—and even scientific journals—have called for the abandoning of statistical significance.22 It may then be tempting to ignore all uncertainty in statistical analyses and base conclusions solely on the value of a single-point estimate (eg, regression coefficient). Such point-estimate-is-the-effect-ism23 relies heavily on the assumption that the point estimate is a valid and precise estimate of the true value, which it often is not.
One of the keys to success for valid causal inference in nonexperimental data is the adequate handling of confounding.24 Successful adjustment for confounding means being able to distinguish potential confounders from intermediates in the causal chain between the factor of interest and the outcome25 and colliders,26 which sometimes is more easily said than done.27 If the right confounders have been selected and adjusted for through, eg, by multivariable regression analysis (notice the distinction from multivariate regression28), it is tempting to also interpret the regression coefficients of the confounding variables as being corrected for confounding, which would be committing a common error known as the Table 2 fallacy.29 While substantiating causal claims is often difficult, avoiding causal inference altogether or simply replacing words like “cause” by “association” is not often the solution.30
With the increasing use of machine learning and artificial intelligence in health care research, this incomplete list of common research design and analysis pitfalls may seem somewhat old-fashioned. Despite the arguably more complex nature of such analyses, many of the aforementioned issues also apply to such studies.31 Among all pitfalls mentioned, the easiest pitfall to avoid is that of incomplete reporting. Avoiding that type of error can be done simply enough by using reporting guidelines (see https://www.equator-network.org/).
Acknowledgments
This list of pitfalls originated in a Twitter post (tinyurl.com/3y3786nc).
References
- Shmueli G. To explain or to predict? Stat Sci. 2010;25(3):289-310. doi:10.1214/10-STS330
- Senn S. Francis Galton and regression to the mean. Significance. 2011;8(3):124-126. doi:10.1111/j.1740-9713.2011.00509.x
- Pearl J. An introduction to causal inference. Int J Biostat. 2010;6(2):7. Internet. doi:10.2202/1557-4679.1203
- Babyak MA. What you see may not be what you get: a brief, nontechnical introduction to overfitting in regression-type models. Psychosom Med. 2004;66(3):411-421.
- Riley RD, Ensor J, Snell KIE, et al. Calculating the sample size required for developing a clinical prediction model. BMJ. 2020;368:m441. doi:10.1136/bmj.m441
- van Smeden M, de Groot JAH, Moons KGM, et al. No rationale for 1 variable per 10 events criterion for binary logistic regression analysis. BMC Med Res Methodol. 2016;16(1):163. doi:10.1186/s12874-016-0267-3
- Huebner M, Vach W, le Cessie S. A systematic approach to initial data analysis is good research practice. J Thorac Cardiovasc Surg. 2016;151(1):25-27. doi:10.1016/j.jtcvs.2015.09.085
- Smith GD, Ebrahim S. Data dredging, bias, or confounding. BMJ. 2002;325(7378):1437-1438. doi:10.1136/bmj.325.7378.1437
- Senn SJ. Dichotomania: An Obsessive Compulsive Disorder That Is Badly Affecting the Quality of Analysis of Pharmaceutical Trials. 2005. Accessed July 20, 2022. https://www.isi-web.org/isi.cbs.nl/iamamember/CD6-Sydney2005/ISI2005_Papers/398.pdf
- Royston P, Altman DG, Sauerbrei W. Dichotomizing continuous predictors in multiple regression: a bad idea. Stat Med. 2006;25(1):127-141. doi:10.1002/sim.2331
- Perperoglou A, Sauerbrei W, Abrahamowicz M, Schmid M. A review of spline function procedures in R. BMC Med Res Methodol. 2019;19(1):46. doi:10.1186/s12874-019-0666-3
- van Smeden M, Lash TL, Groenwold RHH. Reflection on modern methods: five myths about measurement error in epidemiological research. Int J Epidemiol. 2020;49(1):338-347. doi:10.1093/ije/dyz251
- Loken E, Gelman A. Measurement error and the replication crisis. Science. 2017;355(6325):584-585. doi:10.1126/science.aal3618
- Keogh RH, Shaw PA, Gustafson P, et al. STRATOS guidance document on measurement error and misclassification of variables in observational epidemiology: Part 1-Basic theory and simple methods of adjustment. Stat Med. 2020;39(16):2197-2231. doi:10.1002/sim.8532
- Sterne JAC, White IR, Carlin JB, et al. Multiple imputation for missing data in epidemiological and clinical research: potential and pitfalls. BMJ. 2009;338(jun29 1):b2393. doi:10.1136/bmj.b2393
- Hughes RA, Heron J, Sterne JAC, Tilling K. Accounting for missing data in statistical analyses: multiple imputation is not always the answer. Int J Epidemiol. 2019;48(4):1294-1304. doi:10.1093/ije/dyz032
- Basagaña X, Pedersen M, Barrera-Gómez J, et al; ESCAPE Birth Outcomes working group. Analysis of multicentre epidemiological studies: contrasting fixed or random effects modelling and meta-analysis. Int J Epidemiol. 2018;47(4):1343-1354. doi:10.1093/ije/dyy117
- Altman DG, Bland JM. Absence of evidence is not evidence of absence. BMJ. 1995;311(7003):485-485. doi:10.1136/bmj.311.7003.485
- Heinze G, Dunkler D. Five myths about variable selection. Transpl Int. 2017;30(1):6-10. doi:10.1111/tri.12895
- van Smeden M, Moons KG, de Groot JA, et al. Sample size for binary logistic prediction models: beyond events per variable criteria. Stat Methods Med Res. 2019;28(8):2455-2474. doi:10.1177/0962280218784726
- Greenland S, Senn SJ, Rothman KJ, et al. Statistical tests, P values, confidence intervals, and power: a guide to misinterpretations. Eur J Epidemiol. 2016;31(4):337-350. doi:10.1007/s10654-016-0149-3
- Amrhein V, Greenland S, McShane B. Scientists rise up against statistical significance. Nature. 2019;567(7748):305-307. doi:10.1038/d41586-019-00857-9
- Morris T, van Smeden M. Causal analyses of existing databases: the importance of understanding what can be achieved with your data before analysis (commentary on Hernán). J Clin Epidemiol. 2021.
- Hernán MA. Confounding. In: Melnick EL, Everitt BS, eds. Encyclopedia of Quantitative Risk Analysis and Assessment.John Wiley & Sons, Ltd; 2008. doi:10.1002/9780470061596.risk0642
- VanderWeele TJ. Mediation analysis: a practitioner’s guide. Annu Rev Public Health. 2016;37(1):17-32. doi:10.1146/annurev-publhealth-032315-021402
- Greenland S. Quantifying biases in causal models: classical confounding vs collider-stratification bias. Epidemiology. 2003;14(3):300-306. doi:10.1097/01.EDE.0000042804.12056.6C
- Griffith GJ, Morris TT, Tudball MJ, et al. Collider bias undermines our understanding of COVID-19 disease risk and severity. Nat Commun. 2020;11(1):5749. doi:10.1038/s41467-020-19478-2
- Hidalgo B, Goodman M. Multivariate or multivariable regression? Am J Public Health. 2013;103(1):39-40. doi:10.2105/AJPH.2012.300897
- Westreich D, Greenland S. The table 2 fallacy: presenting and interpreting confounder and modifier coefficients. Am J Epidemiol. 2013;177(4):292-298. doi:10.1093/aje/kws412
- Hernán MA. The C-Word: Scientific Euphemisms Do Not Improve Causal Inference From Observational Data. Am J Public Health. 2018;108(5):616-619. doi:10.2105/AJPH.2018.304337
- Wilkinson J, Arnold KF, Murray EJ, et al. Time to reality check the promises of machine learning-powered precision medicine. Lancet Digit Health. 2020;2(12):e677-e680. doi:10.1016/S2589-7500(20)30200-4
Lead Author
Maarten van Smeden, PhD
Affiliations: Julius Center for Health Sciences and Primary Care, University Medical Center Utrecht, Utrecht University, Utrecht, Netherlands.
Corresponding Author
Maarten van Smeden, PhD
Correspondence: Julius Center for Health Sciences and Primary Care, University Medical Center Utrecht, Universiteitsweg 100, 3584 CG Utrecht, Netherlands
Email: M.vanSmeden@umcutrecht.nl
Fetching other articles... 
Loading the comment form...
Submitting your comment...

There are no comments for this article.