Introduction: In regions characterized by limited access to pharmacies—commonly referred to as pharmacy deserts—medication adherence tends to be lower, particularly among underserved and vulnerable populations. Similarly, food deserts denote areas with constrained access to nutritious food options, thereby exacerbating food and nutrition insecurity. While both heavily influence health outcomes, a paucity of literature explores the intersection between pharmacy deserts and food deserts.
Methods: We combined two data sets: (a) community/retail pharmacy brand and location data, and (b) the Food Access data set. A scatterplot was created using the transformed values of pharmacies per 1,000 population and Food Access as the x and y coordinates, respectively. The scatterplot was divided into nine parts based on the 33rd and 67th percentile values of both variables, categorized as a combination of low, median, and high pharmacy and food access. For further analysis, we categorized zip codes with limited access by median income ratio, poverty level, and diversity.
Results: Overall, approximately one-third of all zip codes exhibited low pharmacy access, and another third demonstrated low food access. About 20% of zip codes experienced both low pharmacy and low food access. As the pharmacy access increased, food access also increased, suggesting that zip codes with greater pharmacy access tend to have disproportionately higher food access, consistent with an exponential-type relationship. Low pharmacy and food access were predominantly in zip codes with higher poverty rates and diversity.
Conclusions: Limited access to both pharmacies and nutritious food options places an added burden on vulnerable populations, contributing to challenges in managing chronic diseases and maintaining overall health. This limited accessibility highlights the need for targeted interventions that address these dual resource shortages.
Health maintenance requires a comprehensive approach that extends beyond routine medical checkups and preventative care.1 It encompasses consistent access to essential resources such as medications and nutritious foods to support overall well-being. A major barrier to achieving this holistic form of health maintenance is lack of geographical accessibility to essential resources,2 and this accessibility issue is particularly exacerbated in low-income areas designated as pharmacy3 deserts and food deserts.4
Pharmacy deserts, areas with limited or no pharmacies or pharmaceutical services, often occur in vulnerable communities, particularly Black and Hispanic communities.5 Food deserts are defined as areas lacking nearby supermarkets or grocery stores with nutritious foods6 and with limited reliable transportation to reach them. Together, both conditions have been closely linked to chronic conditions such as diabetes, hypertension, and cardiovascular disease.7,8
The consequences of living in a pharmacy and food desert have been documented as medication adherence and food insecurity, respectively.9 However, little existing literature has directly studied the intersection and impact of living in both a pharmacy desert and a food desert. Using a national data set of open pharmacies in the United States and the Harris County Food Access data set, our study examined the relationship between pharmacy access and food access across Harris County, Texas, which encompasses much of the Greater Houston metroplex. We incorporated socioeconomic and demographic characteristics, specifically income ratio, poverty level, and racial/ethnic composition in contextualizing our findings.
Data Collection and Preparation
We merged two data sets: (a) community/retail pharmacy brands and locations data, obtained from the Homeland Infrastructure Foundation-Level Data open data interface;10 and (b) the Food Access Research Atlas,6 obtained from the US Department of Agriculture (USDA). The USDA data set provides census tract–level demographic and supermarket access measures from 2017, including population, income, poverty level, racial/ethnic composition, vehicle access, and proximity to supermarkets (eg, lahalfand10, la1and20). Following USDA definitions, food access was operationalized as a continuous distance-weighted proximity score (range ≈1.0–3.0), where higher values indicate greater accessibility to food resources. Urban and rural settings were classified according to USDA criteria, based on US Census Bureau designations of population density and metropolitan status. For this study, we extracted data specific to Harris County.
Because food access values are reported at the census tract level, we converted them to the zip code level using a spatial join between tract and zip boundaries in QGIS software. We applied the Intersect (Esri) geoprocessing tool to divide tracts along zip boundaries and performed area-weighted calculations so that each tract contributed proportionally to its overlapping zip code. We aggregated weighted values to generate an average food access score for each zip code. For example, if a zip code contained multiple intersecting tracts, each tract’s food access value was multiplied by the proportion of the tract area within the zip code, and the products were summed to produce the zip code-level score. Finally, to standardize access measures, we divided both pharmacy counts and food access values by the population in each zip code (per 1,000 people). This calculation yielded population-adjusted measures of pharmacy access and food access that were used in subsequent analyses. Our zip code-level analysis was exempt from review by an institutional review board because it involved aggregated, de-identified data that do not allow for the identification of any individual participants.
Visualization and Analysis
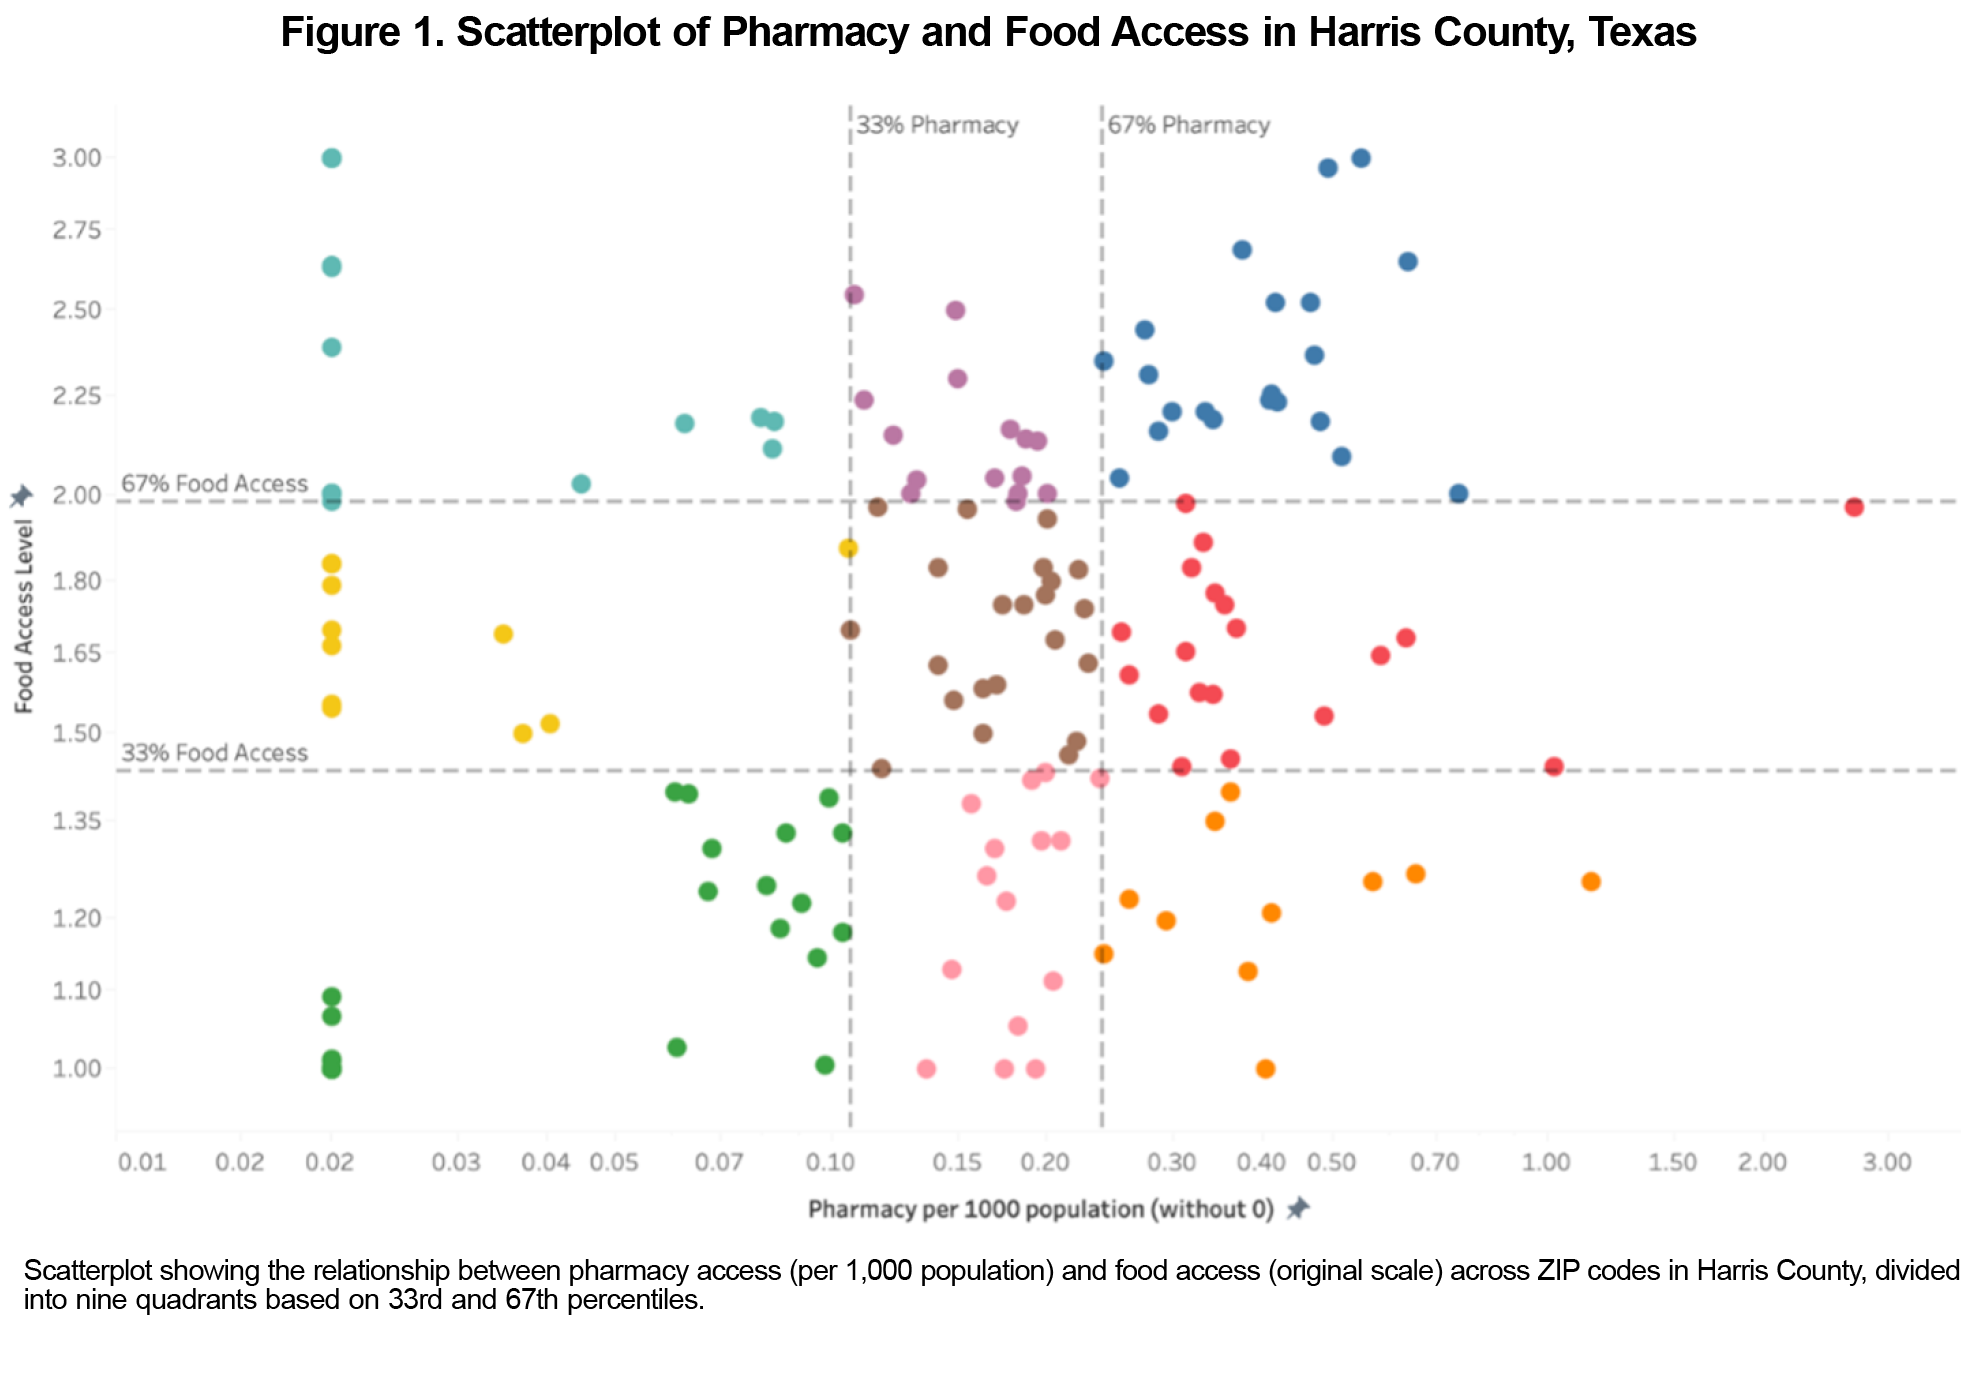
To visualize the relationship between pharmacy access and food access across different ZIP codes, we created a scatterplot using Tableau (Salesforce) software. The transformed values of pharmacies per 1,000 population and food access were used as the x and y coordinates, respectively. The scatterplot was divided into nine parts based on the 33rd and 67th percentile values of both variables. Each part represented a different combination of high, median, and low pharmacy and food access levels. Because the points in the original scatterplot overlapped heavily, making patterns difficult to distinguish, a log scale transformation was applied to pharmacy access per 1,000 population. This transformation reduced skewness and improved separation of points, allowing clearer visualization of the relationship.
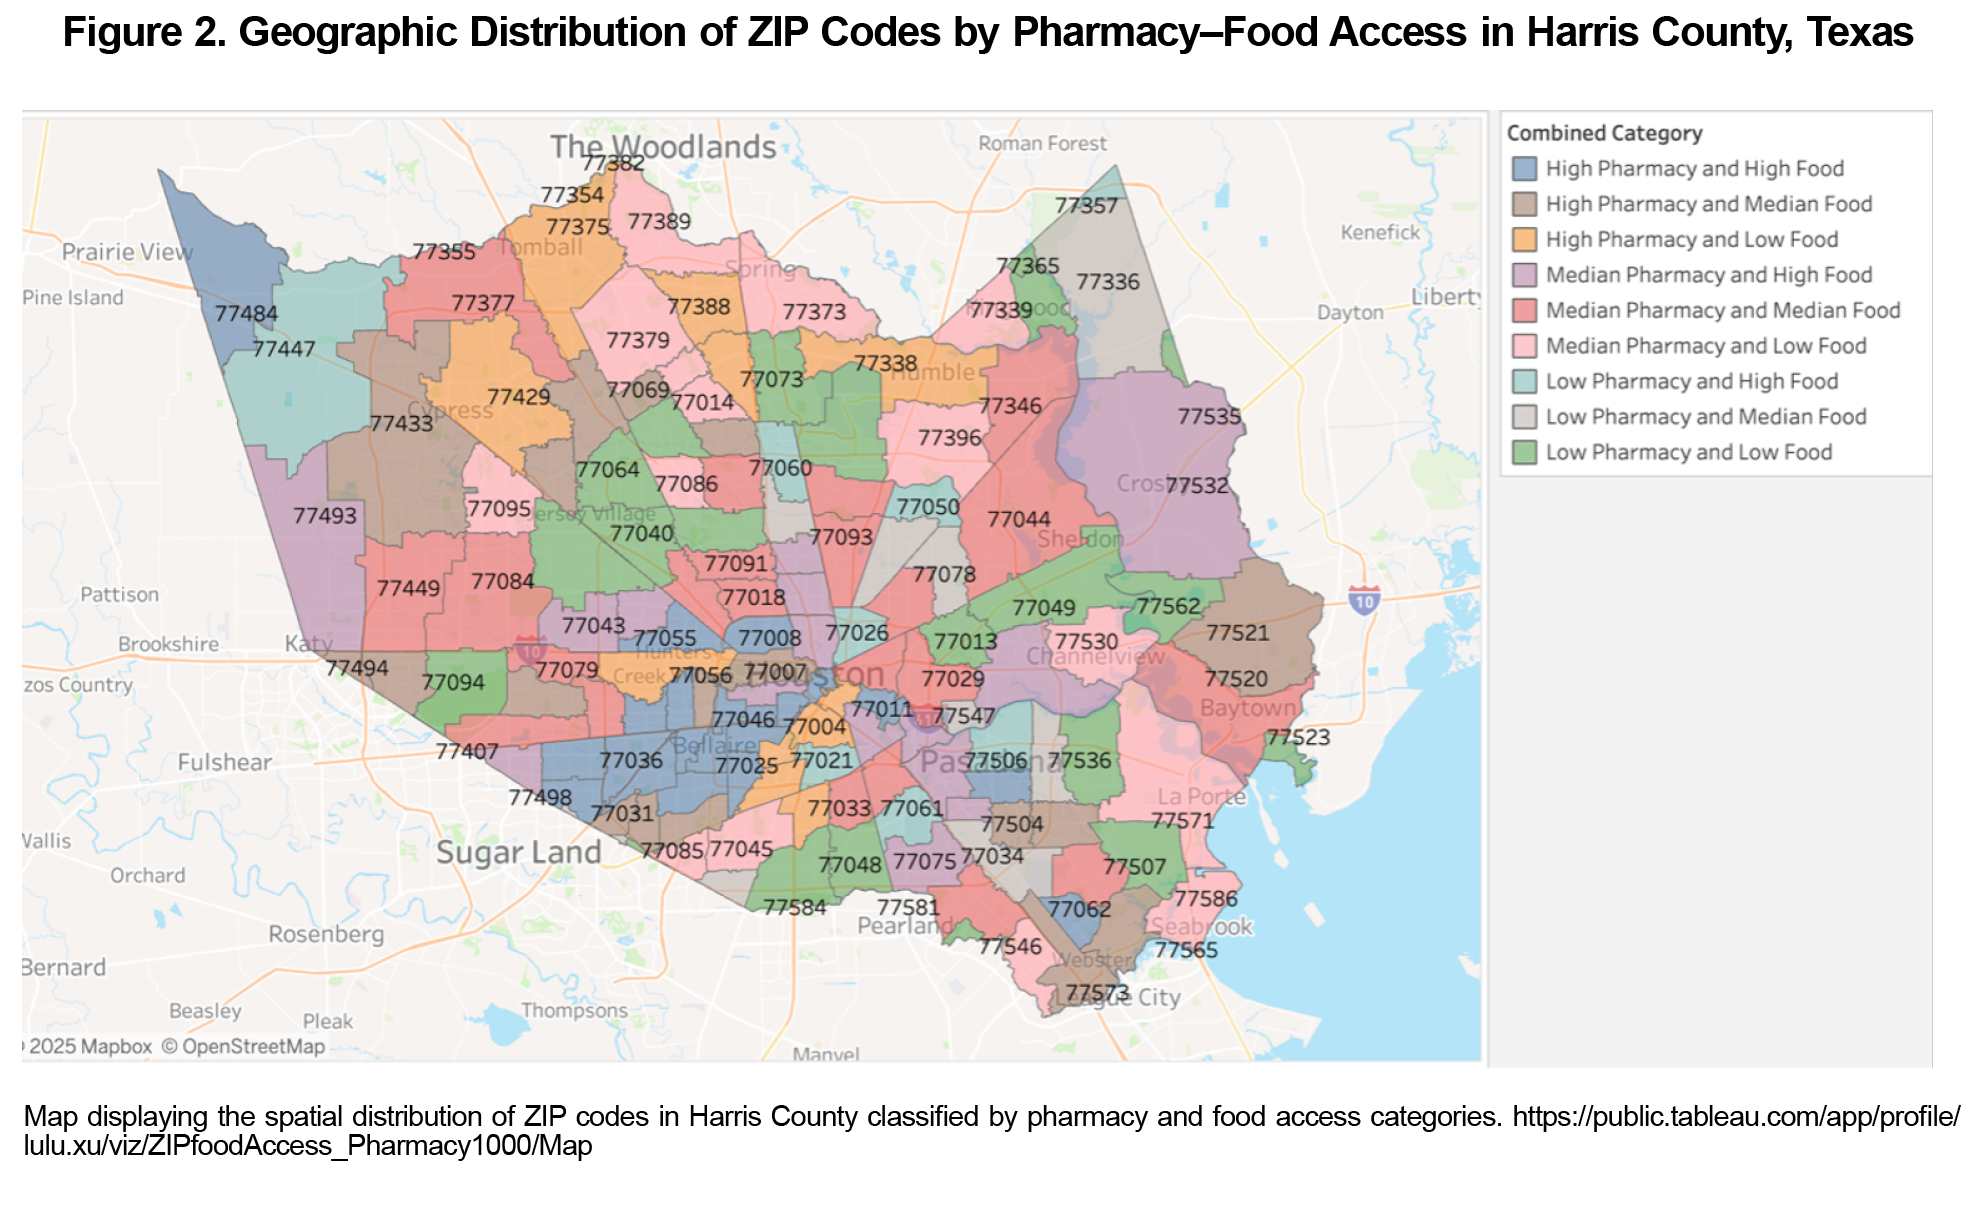
Figure 1 depicts the relationship between pharmacy per 1,000 population (x-axis, log transformed) and food access (y-axis, original scale). With the log transformation, overlapping points became more distinguishable, revealing a positive association: As the log of pharmacy access increases, food access also increases. The observed pattern suggests that ZIP codes with greater pharmacy access tend to have disproportionately higher food access, consistent with an exponential-type relationship (Figure 2).
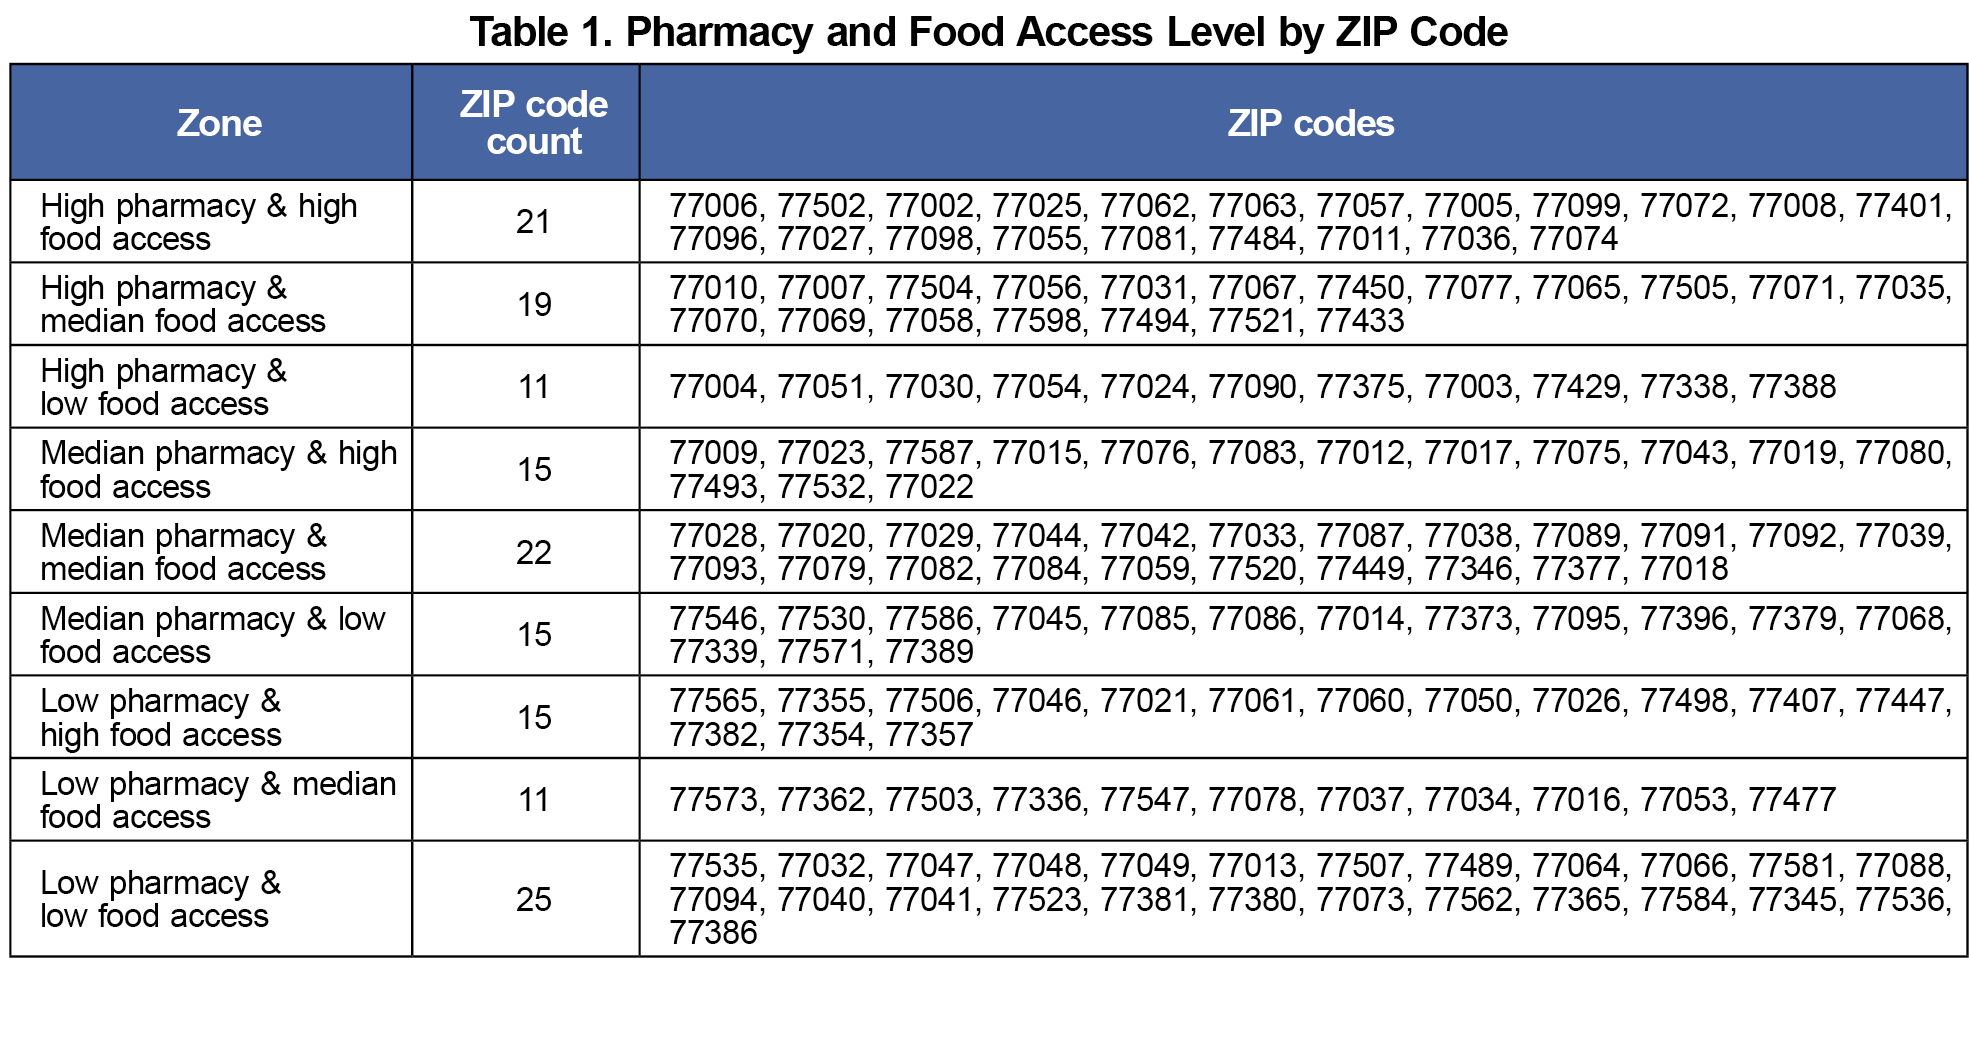
Table 1 shows the distribution of ZIP codes across all pharmacy and food access categories. The count of ZIP codes that fall into each access level combination varied, from 25 ZIP codes in the low pharmacy–low food access category to 21 ZIP codes in the high pharmacy–high food access category. Sixteen percent of the 154 ZIP codes were in areas with low pharmacy and low food access, 33% had at least low pharmacy access, and 33% were classified as low food access areas.
In this mapping and spatial analysis of pharmacy availability and food access in Harris County, one-third of ZIP codes had low pharmacy access, one-third had low food access, and nearly 20% experienced both low pharmacy and low food access. Among ZIP codes with severely limited access (including low pharmacy–low food access, low pharmacy–median food access, and median pharmacy–low food access), 53% had median household incomes below that of the Houston Metropolitan Area, 55% had poverty rates above the national average, and 57% were classified as diverse, with a racial or ethnic group other than non-Hispanic White comprising the majority.11 These findings underscore a critical shortage of both pharmacy resources and food in areas characterized by high poverty and racial diversity. The results align with existing literature, which has consistently linked lower-income and high-poverty areas with a greater prevalence of both pharmacy12,13 and food deserts.14,15 Moreover, the majority of ZIP code areas with limited access overlapped with zones predominantly populated by non-Hispanic Black or Hispanic residents, aligning with current literature that highlights disparities in pharmacy access5 and food availability for these populations. These findings are magnified with recent pharmacy closures, which are expected to affect medically underserved areas disproportionately.16
This overlap implies that the lack of access to essential health resources, such as pharmacies and nutritious food, disproportionately affects communities that are racially and ethnically diverse and that are facing economic hardship. The compounded barriers in these areas may contribute to poorer health outcomes,17,18 higher rates of chronic diseases,19,20 and increased health care disparities,21 underscoring the need for targeted interventions to improve access to vital services in underserved communities. Addressing these challenges requires targeted interventions that prioritize equitable access to pharmacy services and food, ultimately fostering improved health outcomes for vulnerable populations in Harris County.
References
- Fletcher RH, Fletcher SW. Teaching preventive medicine and health maintenance. Ann Intern Med. 1992;116(12 Pt 2):1,094-1,098. doi:10.7326/0003-4819-116-12-1094
- Apparicio P, Gelb J, Dubé AS, Kingham S, Gauvin L, Robitaille É. The approaches to measuring the potential spatial access to urban health services revisited: distance types and aggregation-error issues. Int J Health Geogr. 2017;16(1):32. doi:10.1186/s12942-017-0105-9
- Ying X, Kahn P, Mathis WS. Pharmacy deserts: more than where pharmacies are. J Am Pharm Assoc. 2022;62(6):1,875-1,879. doi:10.1016/j.japh.2022.06.016
- Walker RE, Keane CR, Burke JG. Disparities and access to healthy food in the United States: a review of food deserts literature. Health Place. 2010;16(5):876-884. doi:10.1016/j.healthplace.2010.04.013
- Guadamuz JS, Wilder JR, Mouslim MC, Zenk SN, Alexander GC, Qato DM. Fewer pharmacies in Black and Hispanic/Latino neighborhoods compared with White or diverse neighborhoods, 2007-15. Health Aff (Millwood). 2021;40(5):802-811. doi:10.1377/hlthaff.2020.01699
- Economic Research Service. Food access research atlas. 2025. https://www.ers.usda.gov/data-products/food-access-research-atlas
- Sun Y, Liu B, Rong S, et al. Food insecurity is associated with cardiovascular and all-cause mortality among adults in the United States. J Am Heart Assoc. 2020;9(19):e014629. doi:10.1161/JAHA.119.014629
- Seligman HK, Bindman AB, Vittinghoff E, Kanaya AM, Kushel MB. Food insecurity is associated with diabetes mellitus: results from the National Health Examination and Nutrition Examination Survey (NHANES) 1999-2002. J Gen Intern Med. 2007;22(7):1,018-1,023. doi:10.1007/s11606-007-0192-6
- Whitacre PT, Tsai P, Mulligan J. The Public Health Effects of Food Deserts: Workshop Summary. National Academies Press; 2009.
- DATA.GOV. Pharmacies. 2022. Accessed September 4, 2025. https://catalog.data.gov/dataset/pharmacies?utm_source=chatgpt.com
- Economic Innovation Group. Distressed communities index (DCI). https://eig.org/distressed-communities/?geo=zctas&lat=38.55&lon=-96.42&z=3.58
- Wisseh C, Hildreth K, Marshall J, Tanner A, Bazargan M, Robinson P. Social determinants of pharmacy deserts in Los Angeles County. J Racial Ethn Health Disparities. 2021;8(6):1,424-1,434. doi:10.1007/s40615-020-00904-6
- Qato DM, Daviglus ML, Wilder J, Lee T, Qato D, Lambert B. ‘Pharmacy deserts’ are prevalent in Chicago’s predominantly minority communities, raising medication access concerns. Health Aff (Millwood). 2014;33(11):1,958-1,965. doi:10.1377/hlthaff.2013.1397
- Odoms-Young A, Brown AGM, Agurs-Collins T, Glanz K. Food insecurity, neighborhood food environment, and health disparities: state of the science, research gaps and opportunities. Am J Clin Nutr. 2024;119(3):850-861. doi:10.1016/j.ajcnut.2023.12.019
- Gordon C, Purciel-Hill M, Ghai NR, Kaufman L, Graham R, Van Wye G. Measuring food deserts in New York City’s low-income neighborhoods. Health Place. 2011;17(2):696-700. doi:10.1016/j.healthplace.2010.12.012
- Adepoju OE, Kiaghadi A, Shokouhi Niaki D, Karunwi A, Chen H, Woodard L. Rethinking access to care: a spatial-economic analysis of the potential impact of pharmacy closures in the United States. PLoS One. 2023;18(7):e0289284. doi:10.1371/journal.pone.0289284
- Ali AM, Cobran EK, Young HN. Barriers associated with access to prescription medications in patients diagnosed with type 2 diabetes mellitus treated at federally qualified health centers. Pharmacy (Basel). 2022;10(4):79. doi:10.3390/pharmacy10040079
- Aljahdali AA, Na M, Leung CW. Food insecurity and health-related quality of life among a nationally representative sample of older adults: cross-sectional analysis. BMC Geriatr. 2024;24(1):126. doi:10.1186/s12877-024-04716-9
- Shi L, Lee DC, Haile GP, Liang H, Chung M, Sripipatana A. Access to care and satisfaction among health center patients with chronic conditions. J Ambul Care Manage. 2017;40(1):69-76. doi:10.1097/JAC.0000000000000153
- Leung CW, Kullgren JT, Malani PN, et al. Food insecurity is associated with multiple chronic conditions and physical health status among older US adults. Prev Med Rep. 2020;20:101211. doi:10.1016/j.pmedr.2020.101211
- Rohatgi KW, Humble S, McQueen A, et al. Medication adherence and characteristics of patients who spend less on basic needs to afford medications. J Am Board Fam Med. 2021;34(3):561-570. doi:10.3122/jabfm.2021.03.200361


There are no comments for this article.