Introduction: Primary care physicians advise patients to select and consume healthy foods. But as patients shop their grocery aisles, will food packaging health claims direct them to healthy foods? The argument has been made that such claims might predominantly appear on unhealthy foods. This study investigated whether health claims on front packaging reliably indicated healthier food choices and thus could be used by physicians to guide their patients’ shopping choices.
Methods: From Walmart.com, we sampled 597 items spanning 122 categories of the most commonly consumed foods and beverages in America according to the National Health and Nutrition Examination Survey 2017–2020 database. Two researchers analyzed each product’s front packaging to identify US Food and Drug Administration-approved health claims, nutritional content claims, and functional claims. We evaluated each product’s nutritional facts box to derive an overall numerical nutritional score using the Nutri-Score scheme, representing healthiness.
Results: The number of packaging health claims was not associated with healthiness of foods either in aggregate or within any of the 11 standard food and beverage categories. Food categories traditionally perceived as healthy (eg, fruits, vegetables, grains) generally scored higher in healthfulness compared to categories associated with less healthy choices (eg, snacks, sweets, fats, and oils).
Conclusions: We cannot recommend that patients rely on food packaging health claims to identify healthy or unhealthy foods. Instead, we encourage physicians to advise patients to choose foods from known healthy categories and ignore front-of-package health claims.
Family physicians play a critical role guiding patients toward evidence-based, healthy eating habits and nutritional choices. However, the American diet includes an excessive amount of unhealthy foods, which has long contributed to obesity, diabetes, and other chronic conditions.1 In 2007, journalist Michael Pollan suggested avoiding foods bearing health claims, arguing that the claims often indicate heavily processed, unhealthy foods.2 Reflecting this perspective, studies have continued to raise concerns about the accuracy and oversight of front-of-package health claims.3,4
Front-package messaging is what appeals to and can influence patients’ choices as they shop for groceries. This study investigates the association between the number and type of health claims on the front packaging of US foods and the healthiness of commonly purchased foods, aiming to assess Pollan’s recommendation and provide guidance for family medicine clinicians.
The study used the nation’s largest grocer, Walmart.com, to evaluate food healthfulness and catalog the types and number of promotional health claims on food packaging.
Surveying Foods
We analyzed 11 of the 14 main categories from the US Department of Agriculture’s Beltsville Human Nutrition Research Center’s “What We Eat in America Food Categories,” using 2017–2020 National Health and Nutrition Examination Survey (NHANES) data.5 The categories included milk and dairy, protein foods, grains, snacks and sweets, fruits, vegetables, beverages (other than water), flavored water, fats and oils, condiments and sauces, and sugars. We excluded mixed dishes, alcoholic beverages, and water, focusing on items relevant to regular American shopping habits.
The selected categories contained 122 subcategories.5 For each subcategory, we identified the two most frequently purchased food items and selected five specific items available on Walmart.com. If a frequently purchased item was unavailable, we chose the next most popular option until we had five items per subcategory. Variations that did not affect nutritional content were treated as the same item, while different flavors were counted separately.
Evaluation of Promotional Claims
Promotional claims were categorized into nutrient content claims, function claims, or health claims based on US Food and Drug Administration (FDA) guidelines.6 Nutrient content claims use terms like free, high, or low to describe nutrient levels (eg, “high in fiber”). Function claims highlight general health benefits without specifying direct effects (eg, “supports immune health”). FDA-restricted health claims link a substance to a disease or condition without claiming to diagnose or treat it (eg, “part of a heart healthy diet”).
We analyzed the front packaging, recording the number and type of claims. Allergen claims were considered matters of safety rather than promotion, and were excluded; whereas terms like gluten-free, organic, and keto-friendly were included as nutrient content claims due to their promotional intent. After two independent raters counted all the promotional health claims, discrepancies of more than one were resolved through discussion.
Evaluation of the Healthfulness of Foods
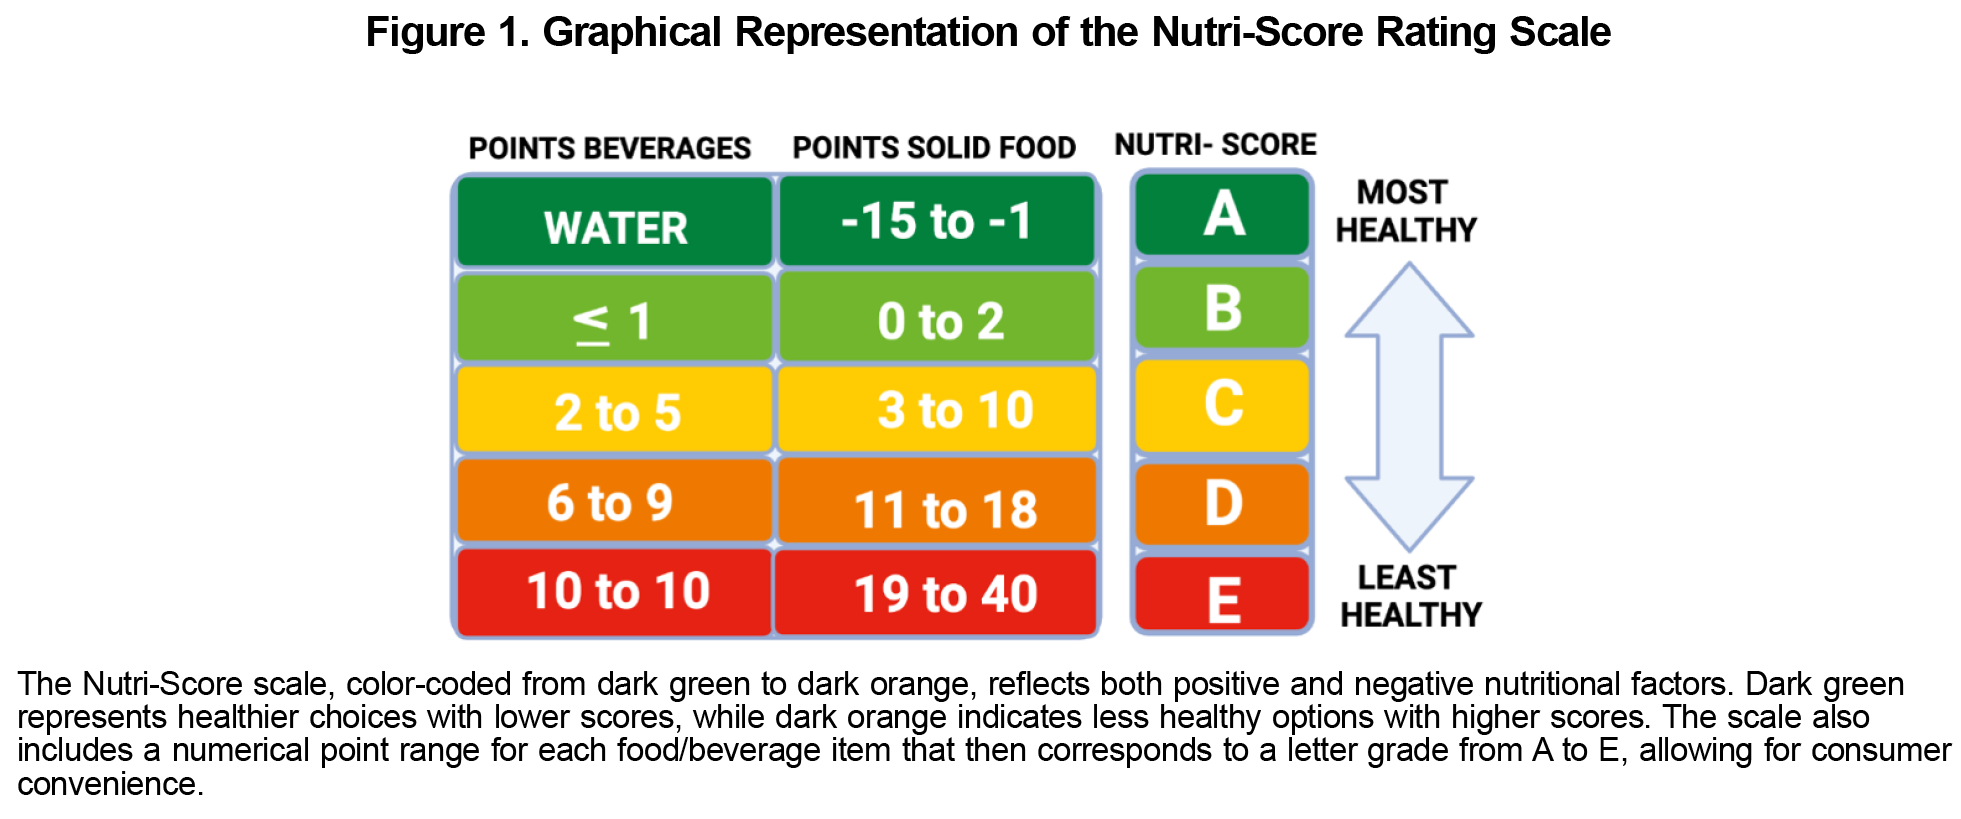
To assess food healthfulness, we used the Nutri-Score system, an ordinal scale from the British Food Standards Agency and endorsed by the World Health Organization (WHO). The scoring system evaluates nutritional quality based on positive (fruits, vegetables, fiber, protein) and negative (saturated fats, sugars, salt) factors. This calculation yields a numerical score where lower values indicate healthier choices (Figure 1).7,8
For a consumer’s convenience in European markets, these numerical scores are converted into grades ranging from A (healthiest) to E (least healthy). However, due to the arbitrary numerical cutoffs that correspond to each item’s letter grade, we instead analyzed the numerical values used in the Nutri-Score system, using calculation formulas obtained from the official Nutri-Score documentation; we refer to this value as the nutritional score.6,8 We collected study data including uploaded images of front packaging, nutrition labels, and ingredient lists. These data were managed using SUNY Upstate Medical University’s REDCap platform.9,10
Statistical Analysis
Nutritional scores were derived from nutrition label data, and promotional health claims were categorized by type and category. Several ordinary least squares linear models were fit and evaluated, relating front-of-packaging claims as predictor to nutrition score as response. Residual diagnostic plots from the selected ordinary least squares regression model indicated a reasonable fit. All analyses were conducted in R (R Foundation).
Across 11 item categories, a total of 597 items were analyzed, with nutritional content claims (1,073 total) being the most common. Due to the low numbers of FDA-approved restricted health claims (14 total) and function claims (22 total), these two claim types were excluded from further analysis.
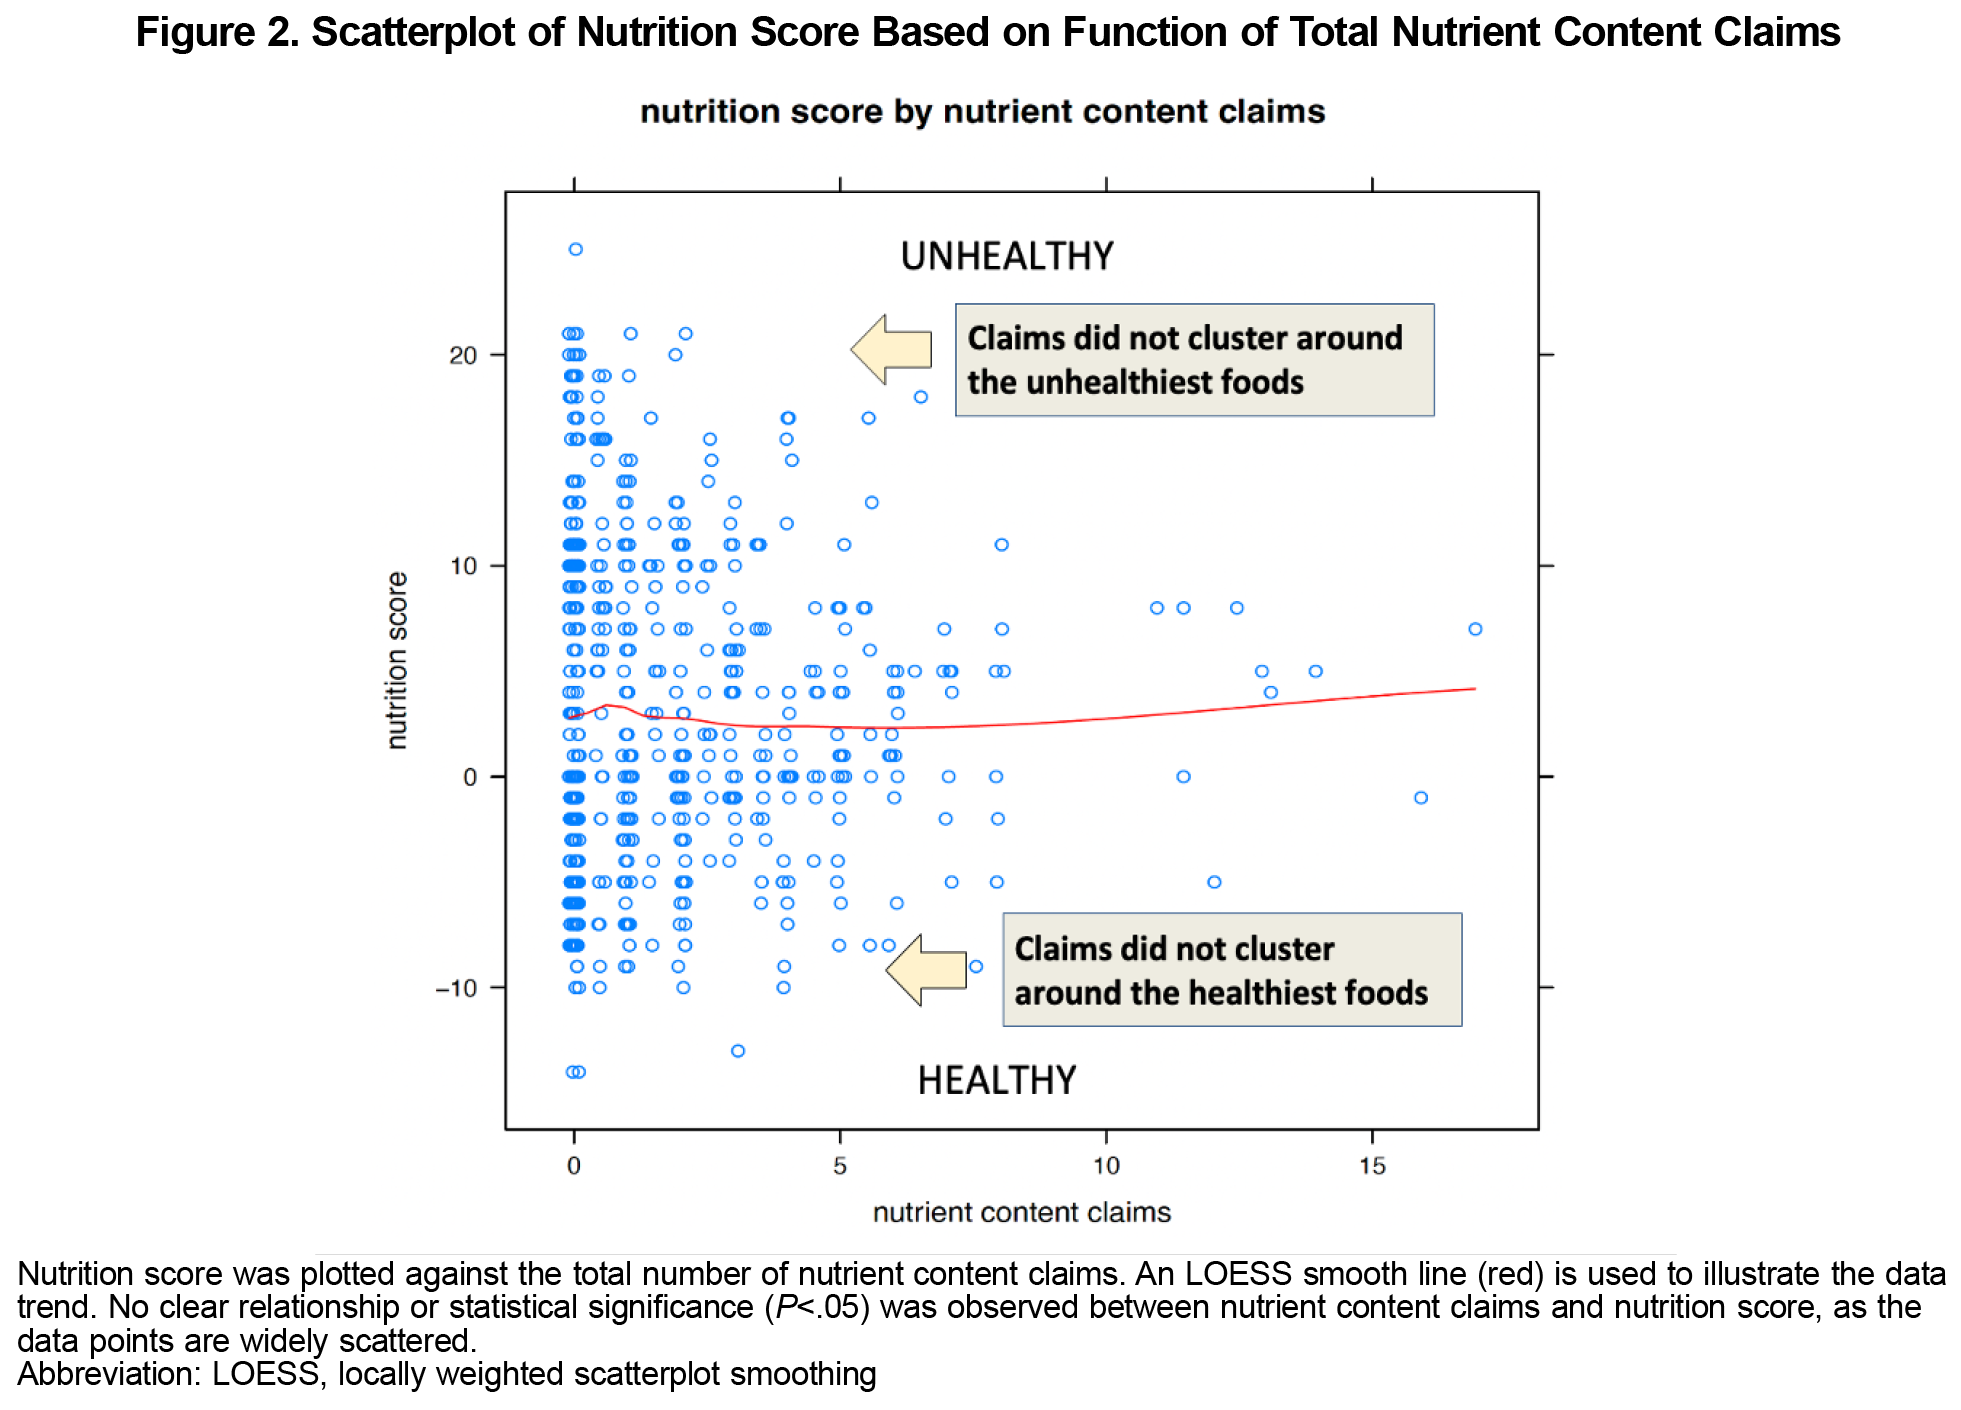
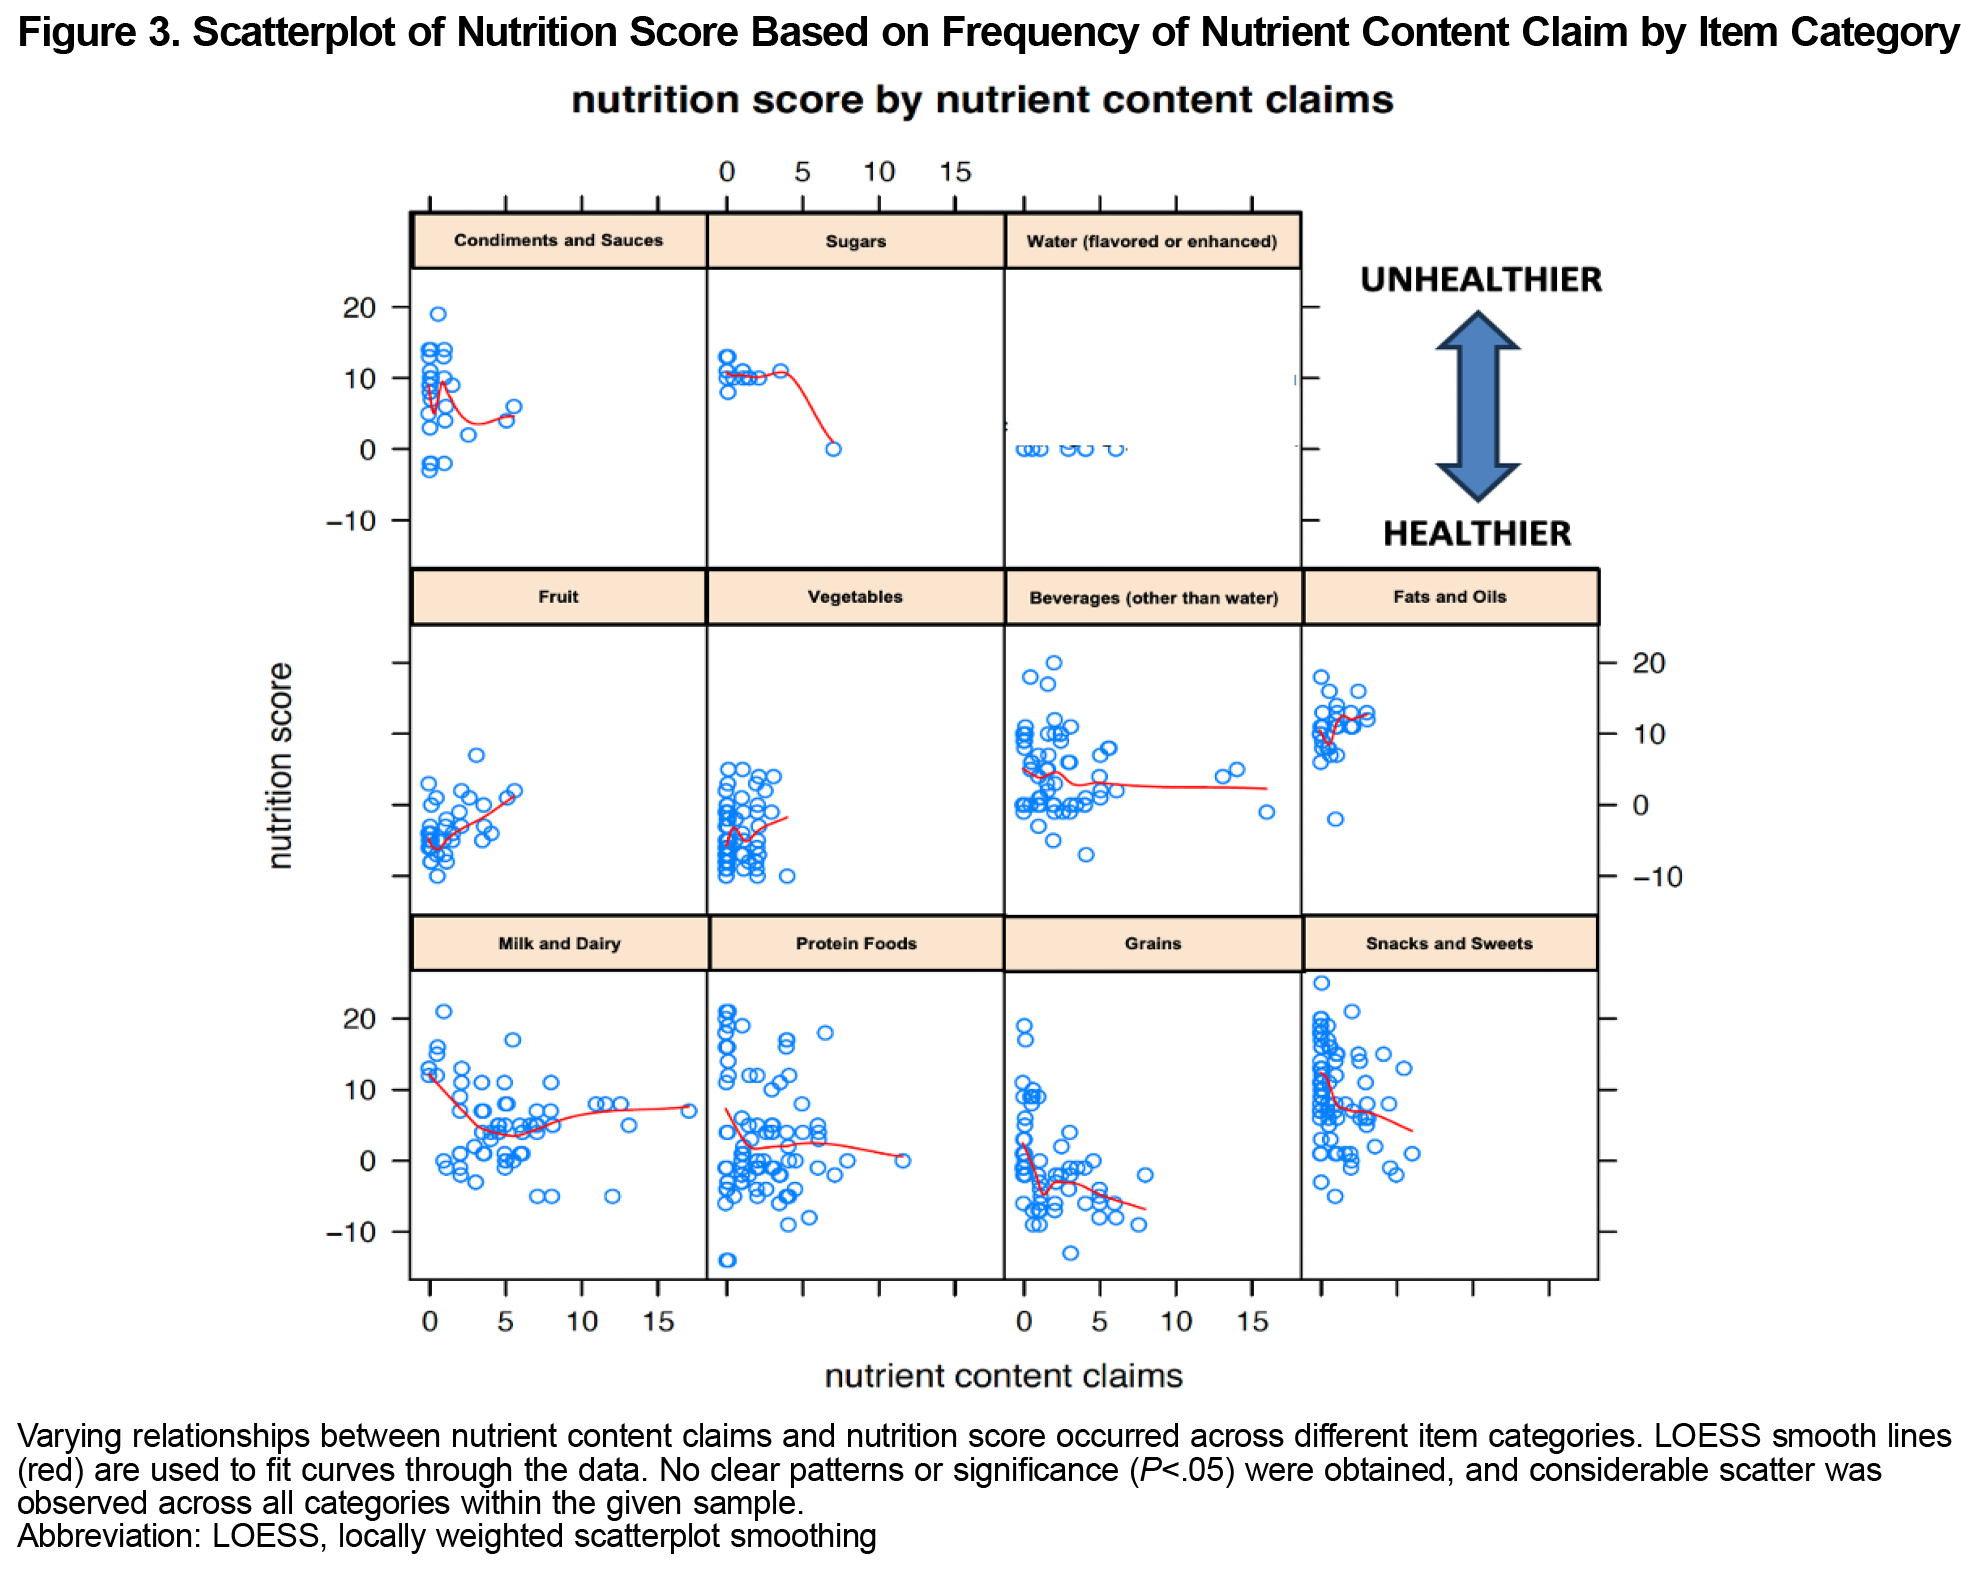
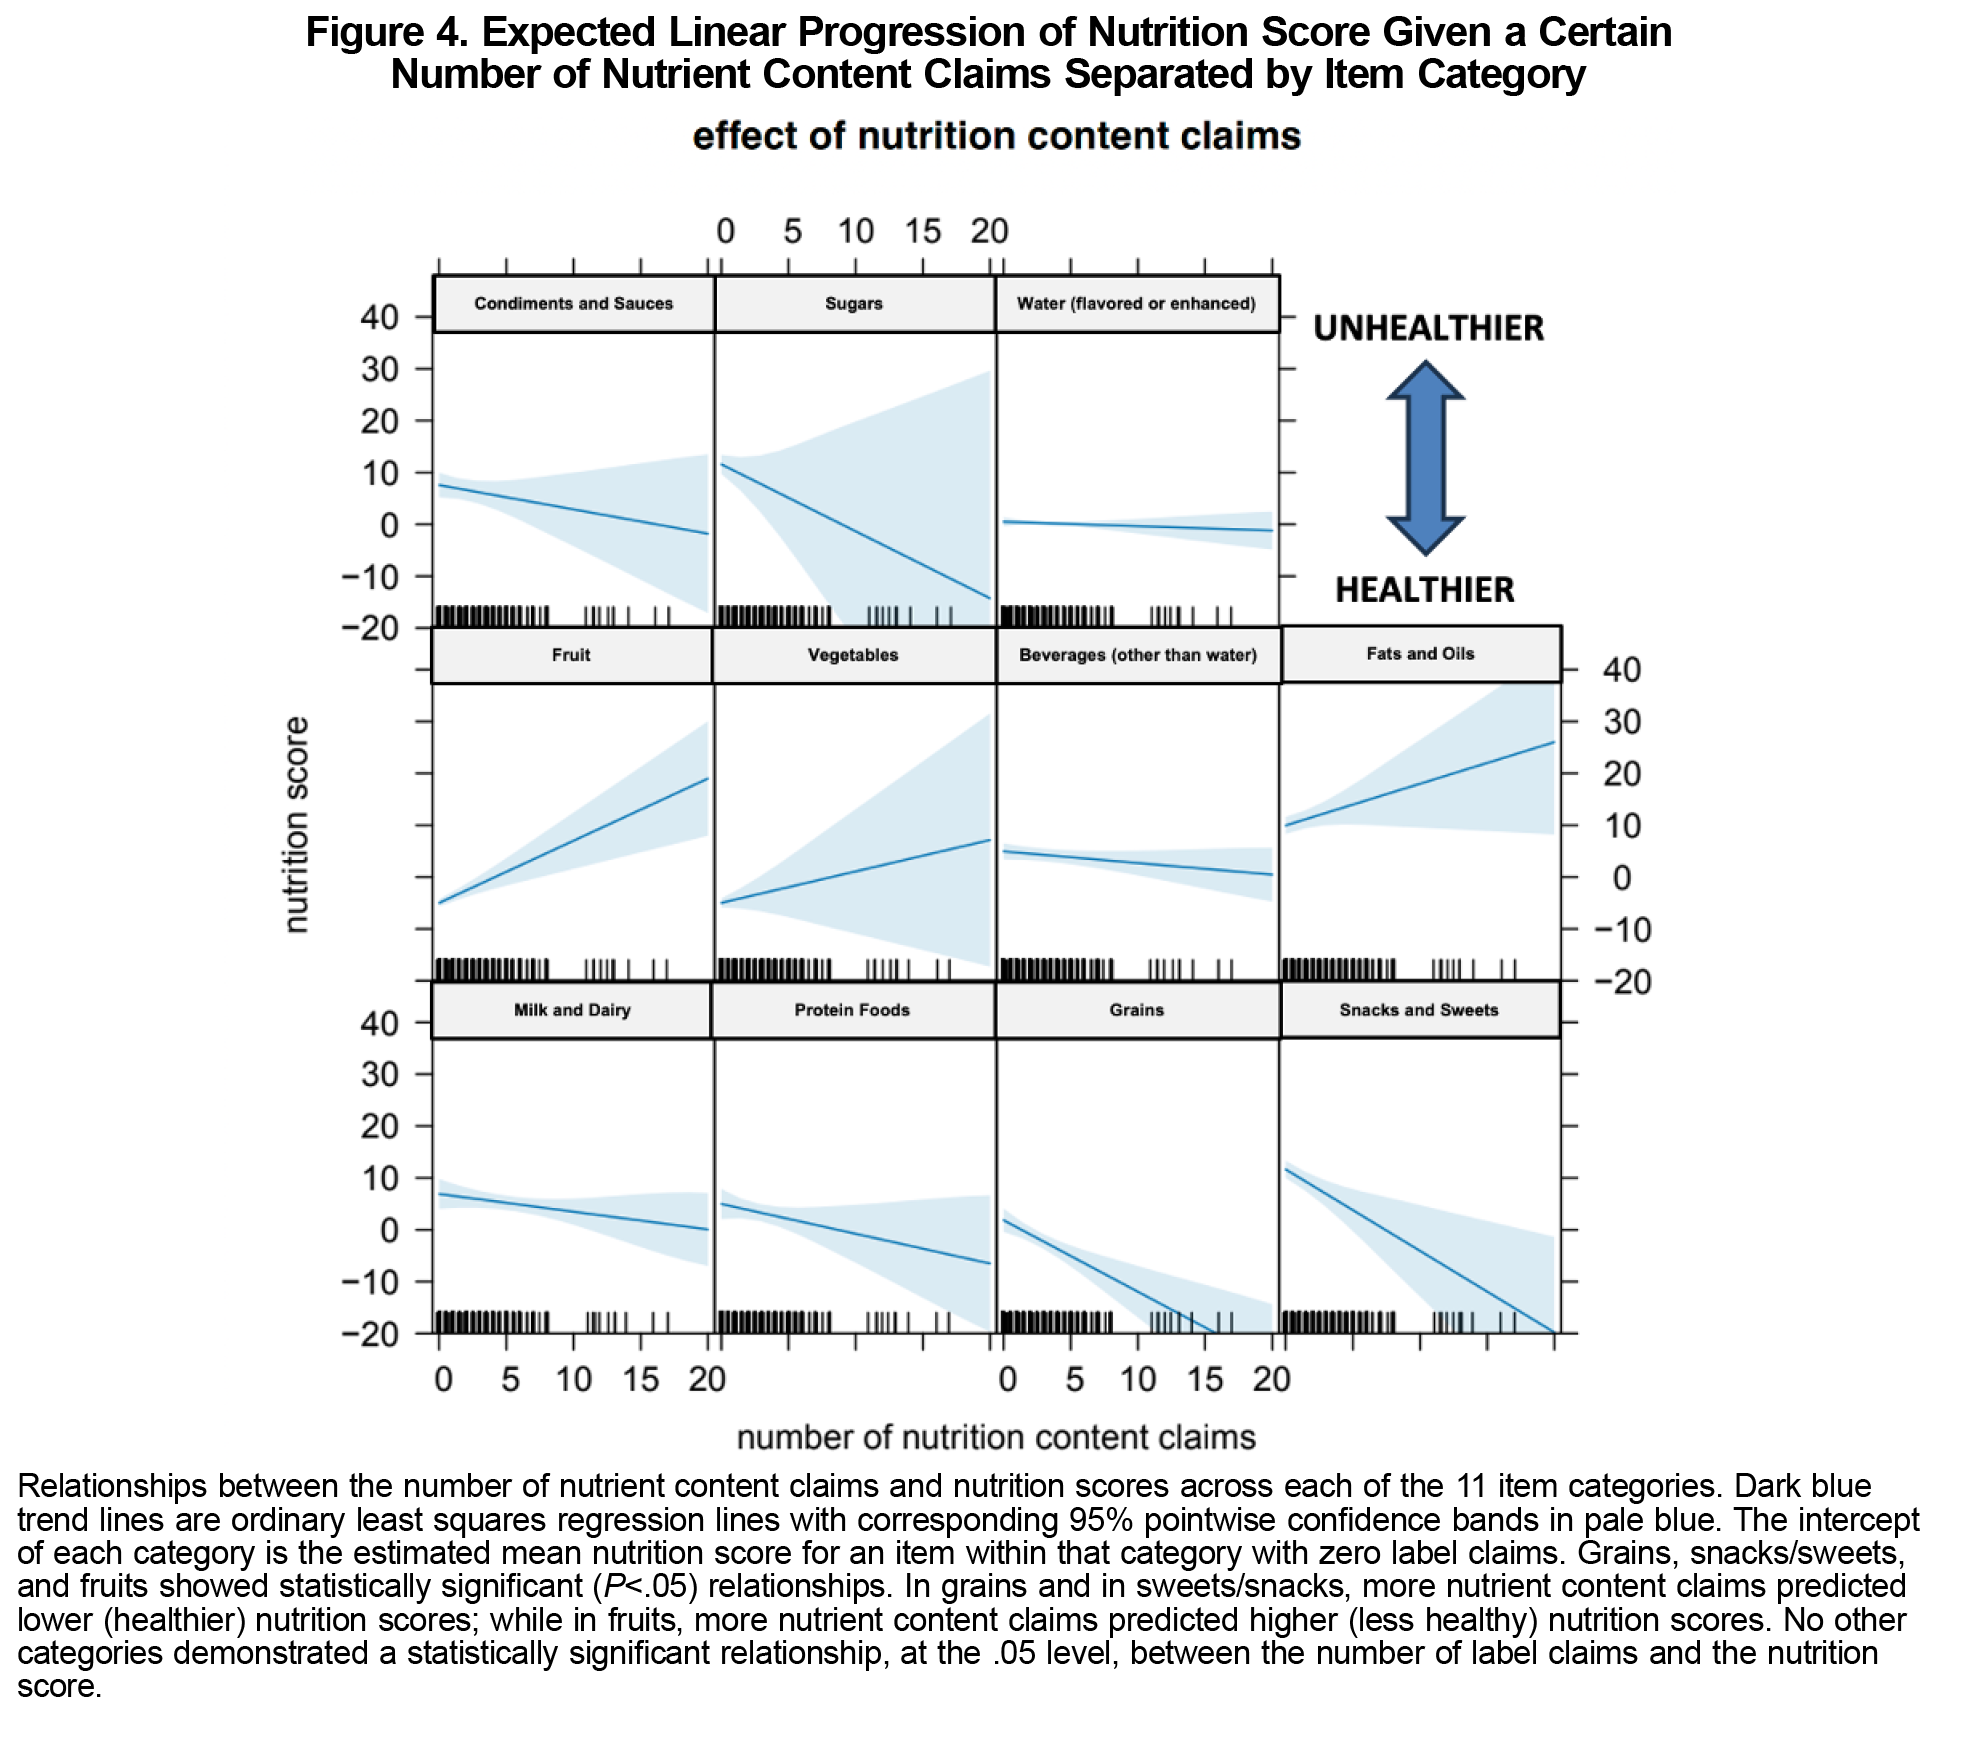
In our sample, we found no significant association between the total number of nutritional content claims and the overall item nutritional score (Figure 2). No consistent relationship was observed between nutrient content claims and nutritional scores when separated by item category (Figure 3). The linear regression model revealed a statistically significant improvement (P<.05) in nutrition score as label claims increased for item categories of grains and sweet/snacks. In contrast, for fruits, the nutrition score was significantly worsened (P<.05) as label claims increased.
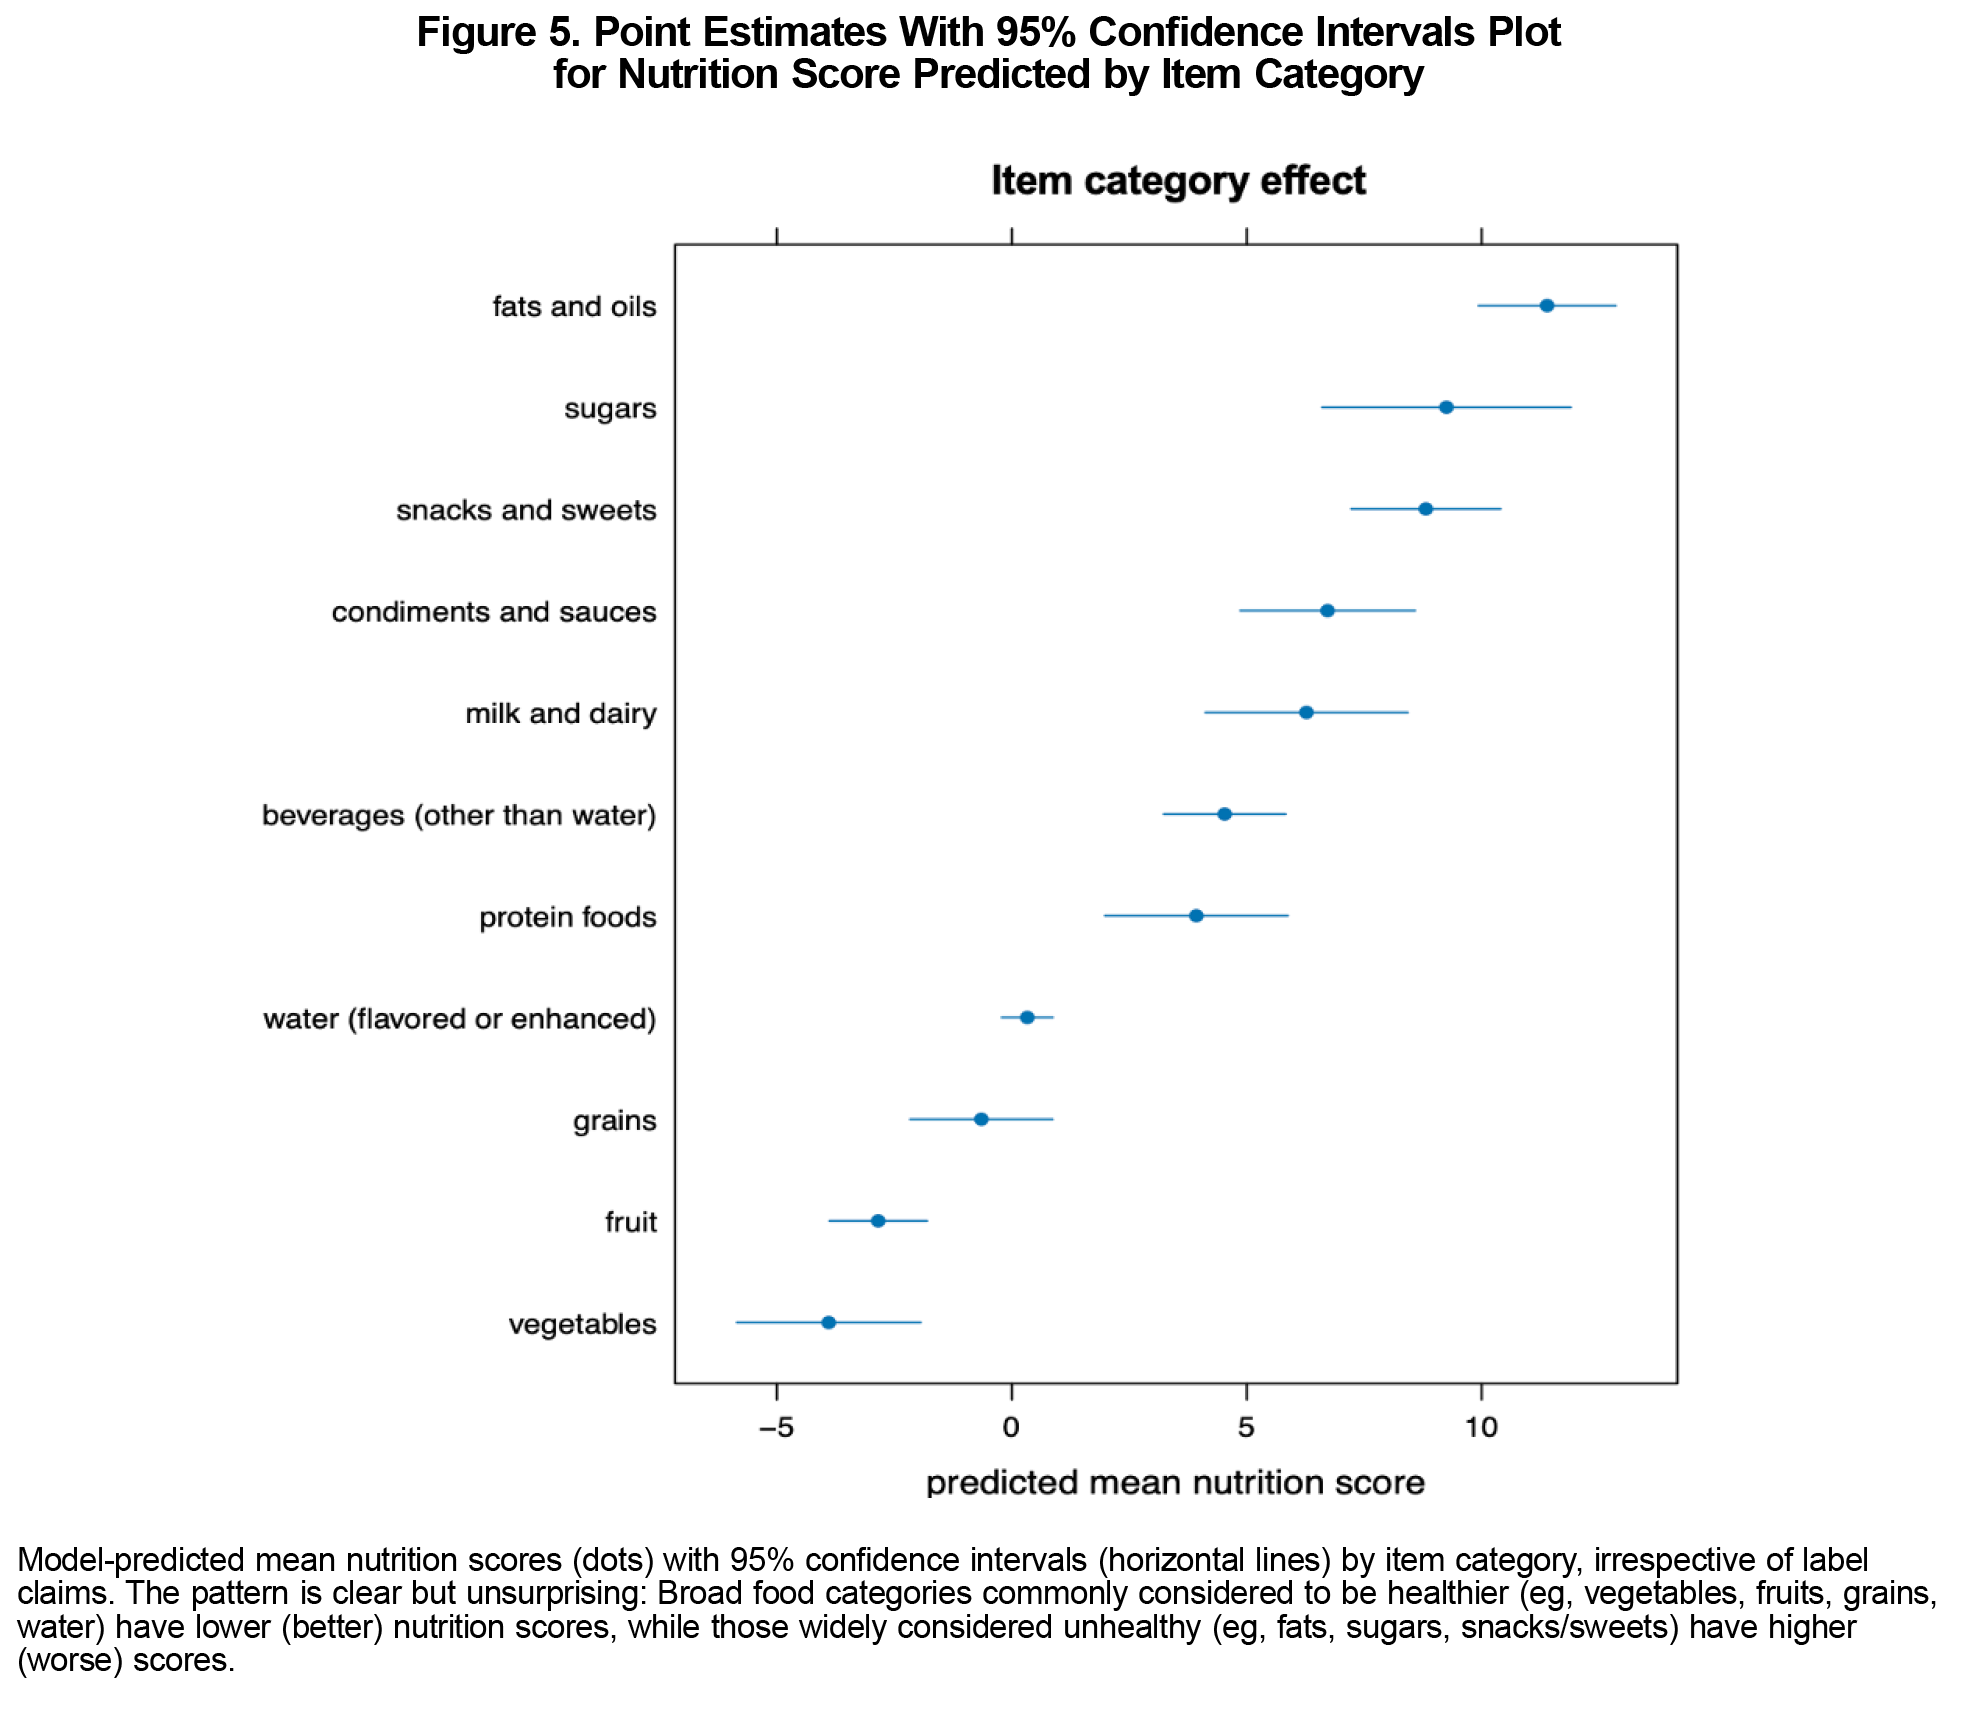
In no other item category did we find a significant relationship between nutrition score and number of label claims (Figure 4). However, the overall relationship between the number of nutrition label claims and healthfulness of a grocery item remained small and inconsistent. As for item category, we found a clear association with nutrition score, with items conventionally considered healthier (eg, vegetables, fruits) having better scores than items conventionally considered less healthy (eg, sugars, fats). This finding reinforces commonly accepted nutritional guidance (Figure 5).
In our sample, packaging health claims did not consistently reflect actual healthiness. The grocery item category (eg, vegetable, dairy, fruit) was a better predictor of overall nutritional value compared to the number of nutrient content health claims.
However, this study did have certain limitations. Using an online grocery store streamlined data collection but raised concerns. To replicate an in-person shopping experience, we counted only claims visible on the front packaging. Online images might have shown different claims than those encountered in-store, potentially skewing reporting. Demographic factors such as income could have affected the overall frequency of food/ beverage items purchased. Only 11 out of 14 categories from the 2017–2020 NHANES database were included, which could have influenced results. Additionally, some evaluations, such as health claims and nutritional content, relied on researcher judgment, introducing potential human error despite adherence to standard protocols. Finally, while any single score for food healthfulness, including Nutri-Score, is inherently reductionist, it is a logical, evidence-based system endorsed by WHO and European authorities, making these observations reasonable.
Overall, we recommend that physicians encourage patients to choose foods from well-established healthy categories rather than relying on packaging claims while shopping.
Acknowledgments
The authors thank SUNY Upstate graduates Claudia Heritage, MD; Megan Lafferty, MD; Hector Ayarza, MD; Ashley Cobb, MD; Andrulisa Jones, MD; Colin Pritchard, MD; Kelly Reese, MD; Andrew Salmons, MD; and Priyanka Talagadadeevi, MD; and SUNY Binghamton graduate Hetvi Trivedi, BS, for their contributions to the methodology for the study. Additionally, they thank Neyda Gilman, health sciences reference librarian at Binghamton University, for the literature search; and United Health Services, Inc, Institutional Review Board for evaluation and approval of our research protocol on July 5, 2023.
Presentations
This study was presented as a poster at the following conferences:
- Family Medicine Education Consortium, October 14, 2023, Providence, RI
- Family Physicians Winter Weekend, January 14. 2024, Lake Placid, NY
- Charles Ross Memorial Student Research Day, March 19, 2024, Syracuse, NY
- Binghamton Biomedical Research Conference, April 4, 2024, Binghamton, NY
- North American Primary Care Research Group, November 23, 2024, Quebec City, Canada
Conflict of Interest Statement
The authors have no conflicts of interest to declare.
References
- Liu J, Lee Y, Micha R, Li Y, Mozaffarian D. Trends in junk food consumption among US children and adults, 2001-2018. Am J Clin Nutr. 2021;114(3):1,039-1,048. doi:10.1093/ajcn/nqab129
- Pollan M. The Omnivore’s Dilemma: A Natural History of Four Meals.Penguin Books; 2006.
- Nestle M, Ludwig DS. Front-of-package food labels: public health or propaganda? JAMA. 2010;303(8):771-772. doi:10.1001/jama.2010.179
- Colby SE, Johnson L, Scheett A, Hoverson B. Nutrition marketing on food labels. J Nutr Educ Behav. 2010;42(2):92-98. doi:10.1016/j.jneb.2008.11.002
- U.S. Department of Agriculture. What we eat in America food categories, 2017–March 2020 prepandemic; DMR–food categories. USDA Agricultural Research Service. 2018. Accessed June 27, 2023. https://www.ars.usda.gov/ARSUserFiles/80400530/apps/WWEIA2017_March2020_foodcat_FNDDS.xlsx
- U.S. Food and Drug Administration. Label claims for conventional foods and dietary supplements. 2023. Accessed October 13, 2023. https://www.fda.gov/food/nutrition-food-labeling-and-critical-foods/label-claims-conventional-foods-and-dietary-supplements
- van der Bend DLM, van Eijsden M, van Roost MHI, de Graaf K, Roodenburg AJC. The Nutri-Score algorithm: evaluation of its validation process. Front Nutr. 2022;9:974003. doi:10.3389/fnut.2022.974003
- Hercberg S, Touvier M, Salas-Salvado J; Group of European scientists supporting the implementation of Nutri-Score in Europe. The Nutri-Score nutrition label: a public health tool based on rigorous scientific evidence aiming to improve the nutritional status of the population. Int J Vitam Nutr Res. 2022;92(3-4):147-157. doi:10.1024/0300-9831/a000722
- Harris PA, Taylor R, Thielke R, Payne J, Gonzalez N, Conde JG. Research electronic data capture (REDCap)—a metadata-driven methodology and workflow process for providing translational research informatics support. J Biomed Inform. 2009;42(2):377-381. doi:10.1016/j.jbi.2008.08.010
- Harris PA, Taylor R, Minor BL, et al; REDCap Consortium. The REDCap consortium: building an international community of software platform partners. J Biomed Inform. 2019;95:103208. doi:10.1016/j.jbi.2019.103208


There are no comments for this article.