Background and Objectives: Racial/ethnic score disparities on standardized tests are well documented. Such differences on the American Board of Family Medicine (ABFM) certification examination have not been previously reported. If such differences exist, it could be due to differences in knowledge at the beginning of residency or due to variations in the rate of knowledge acquisition during residency. Our objective was to examine the residents’ mean initial scores and score trajectories using the In-Training Examination (ITE) and certification examination.
Methods: A total of 17,275 certification candidates from 2014 to 2019 were included in this study. Annual ITE scores and certification examination scores are reported on the same scale and serve as the outcome. We conducted multilevel longitudinal regression to determine initial knowledge and growth in knowledge acquisition during residency by race/ethnicity categories.
Results: The mean postgraduate year 1 (PGY-1) ITE score was 393.3, with minority residents scoring 16.2 to 36.0 points lower compared to White residents. The mean increase per year in exam performance from PGY-1 ITE to the certification exam was 39.9 points (95% CI, 38.7, 41.1) with additional change among race/ethnicity categories per year of -3.2 to 1.9 points.
Conclusions: This study found that there were initial score disparities across race/ethnicity groups in PGY-1, and these disparities continued at the same rate throughout residency training, suggesting equality in acquisition of knowledge during family medicine residency training but with a persistent gap throughout training.
Score differences across racial/ethnic groups on standardized certification, licensing, and college admissions tests are well documented.1-5 These score differences have also been observed in the medical field. On the Medical College Admission Test (MCAT), a considerable mean score difference with a large effect size has been documented between Black and White examinees and between Hispanic and non-Hispanic examinees.6 On the United States Medical Licensing Examination (USMLE) across all three steps of the examination, score differences of approximately one standard deviation (SD) were present between Black and White examinees.7 These score differences are often attributed to inequities in the US educational system, which are related to socioeconomic disparities that occur along racial and ethnic lines.8
Little is known about whether these gaps are narrowed, widened, or maintained with additional education. Family medicine residency provides a unique research opportunity to address this question. Each year, a cohort of residents is admitted to a 3-year Accreditation Council for Graduate Medical Education (ACGME)-accredited residency program,9 and presumably the entire cohort receives a standardized and comparable residency training that meets the ACGME accreditation criteria. Does a racial/ethnic score disparity exist initially? Do disparities increase, decrease, or remain the same over the course of residency?
Although there may be mean score differences across groups, we would also like to know if the score differences could be attributed to other variables. Personal characteristics associated with higher American Board of Family Medicine (ABFM) Family Medicine Certification Examination (FMCE) scores for initial certifiers include female gender, medical degree (MD vs DO), US-based medical school (vs international based), younger age, and lower relative educational debt.10 Recent cohorts of initial certifiers performed better than earlier initial certifiers (prior to 2014) with the international medical graduates’ (IMG) pass rate increasing faster than the US Medical Graduates’ (USMG) pass rates.11
This study aims to answer three questions. Is there a racial/ethnic score disparity manifested in the first year of residency? If there is an initial score disparity, does it increase, decrease, or remain the same over the course of residency training? Does the racial/ethnic disparity persist after controlling for several other covariates?
Participants
The participants in the study were all residents who graduated from an ACGME-accredited family medicine residency program and took the ABFM FMCE between 2014 and 2019. To ensure comparability of educational experience, we excluded residents with multiple training programs, those with more than 3 years of training (combined training or demonstration projects), and those who finished training later than expected for any reason. We also kept only residents with complete examination data: In Training Examination (ITE) at postgraduate year (PGY) 1, PGY2, PGY3, and FMCE score. The American Academy of Family Physicians’ Institutional Review Board approved this study. We performed all statistical analysis in R, version 4.0.2 (R Foundation for Statistical Computing, Austria).
Race/Ethnicity Data
We obtained self-reported race and ethnicity data from the demographics section of the application to sit for the FMCE, which must be completed 3 to 4 months prior to the examination. Consistent with the US Census Bureau’s race and ethnicity categorization, race and ethnicity were considered separately. Specifically, ethnicity is dichotomized as Hispanic or Latino and non-Hispanic; race is categorized as Asian, White, Black, American Indian/Alaska Native, Native Hawaiian/other Pacific Islander, or Other (does not identify with the above given race categories for any reason).
Instruments
Family Medicine Certification Scale. The Family Medicine Certification Scale is a common scale that is used to describe examinee performance on several of ABFM’s examinations, including the ITE and FMCE. On this scale, scores can range from 200 to 800 and are reported in increments of 10. Scores lower than 200 are reported as 200 and scores greater than 800 are reported as 800. Examinations that use this scale are built to common specifications as defined in the current ABFM certification examination blueprint.12 Additionally, the difficulty of the questions and the ability estimate of the physicians are equated onto the same scale to facilitate direct comparisons. In this study, the residents’ scores were their scaled scores on the ITE and FMCE. Because an equated common scale was used, direct comparisons of scores are possible across tests and over time; therefore, growth can be measured without resorting to norm-based approaches.
ITE. The ITE is a low-stakes, multiple-choice question examination intended to provide residents with the opportunity to take a test with the same look and feel as the FMCE. During the study period, the ITE consisted of 240 questions. The Rasch reliability of the ITE is typically 0.84.13,14
FMCE. Passing the FMCE is a requirement for earning ABFM certification. During the period of this study, it consisted of 320 to 370 multiple-choice questions and the passing score was 380. The Rasch reliability of the FMCE is typically 0.94.13,14
Design
This study employed a natural groups design. The six different residency cohorts, 2014-2019, represent temporal replications of this same natural groups experiment. The mean examination scores for different racial and ethnic groups within each cohort represent the ability level of the group at that time. The specific points in time at which the examinations were administered represent different amounts of time spent in residency. More specifically, PGY1, PGY2, PGY3, and the FMCE represent 4, 16, 28, and 34 months of residency training, respectively. We reviewed mean performance trends for the different racial/ethnic groups across the four timepoints regarding the comparability of relative improvement and the absolute equivalence of performance.
Analysis
We calculated the mean performance by racial/ethnic groups by year of residency and replicated by cohort, then plotted. We utilized t test and analyses of variance to compare the mean of the scaled scores. We adjusted the significance value used in the t tests using a Bonferroni correction (α=0.008) to adjust for the inflation of Type I error caused by conducting multiple comparisons. Additionally, we analyzed scaled scores from PGY1 to FMCE using two different linear mixed models. Linear mixed models consist of fixed effects and random effects. In the first model, the fixed effects included the intercept (PGY-1 mean scaled score) and the slope (which quantifies the progress of residents from PGY1 to FMCE). The slope is the focus of this analysis. If the slope is similar across race/ethnicity, it indicates that residents of different races/ethnicities have similar rates of progress; otherwise it suggests different rates of knowledge acquisition during residency, either decreased or increased. The random effects include random intercept as individuals and programs to account for correlations among residents themselves and residents who enrolled in the same program, leading to robust standard errors for fixed effects. This methodology accounts for variations among programs. In the second model, other variables associated with exam performance were also included in the fixed effects: gender, medical degree (MD vs DO), country of medical education (USMG vs IMG), and educational debt.
Demographics
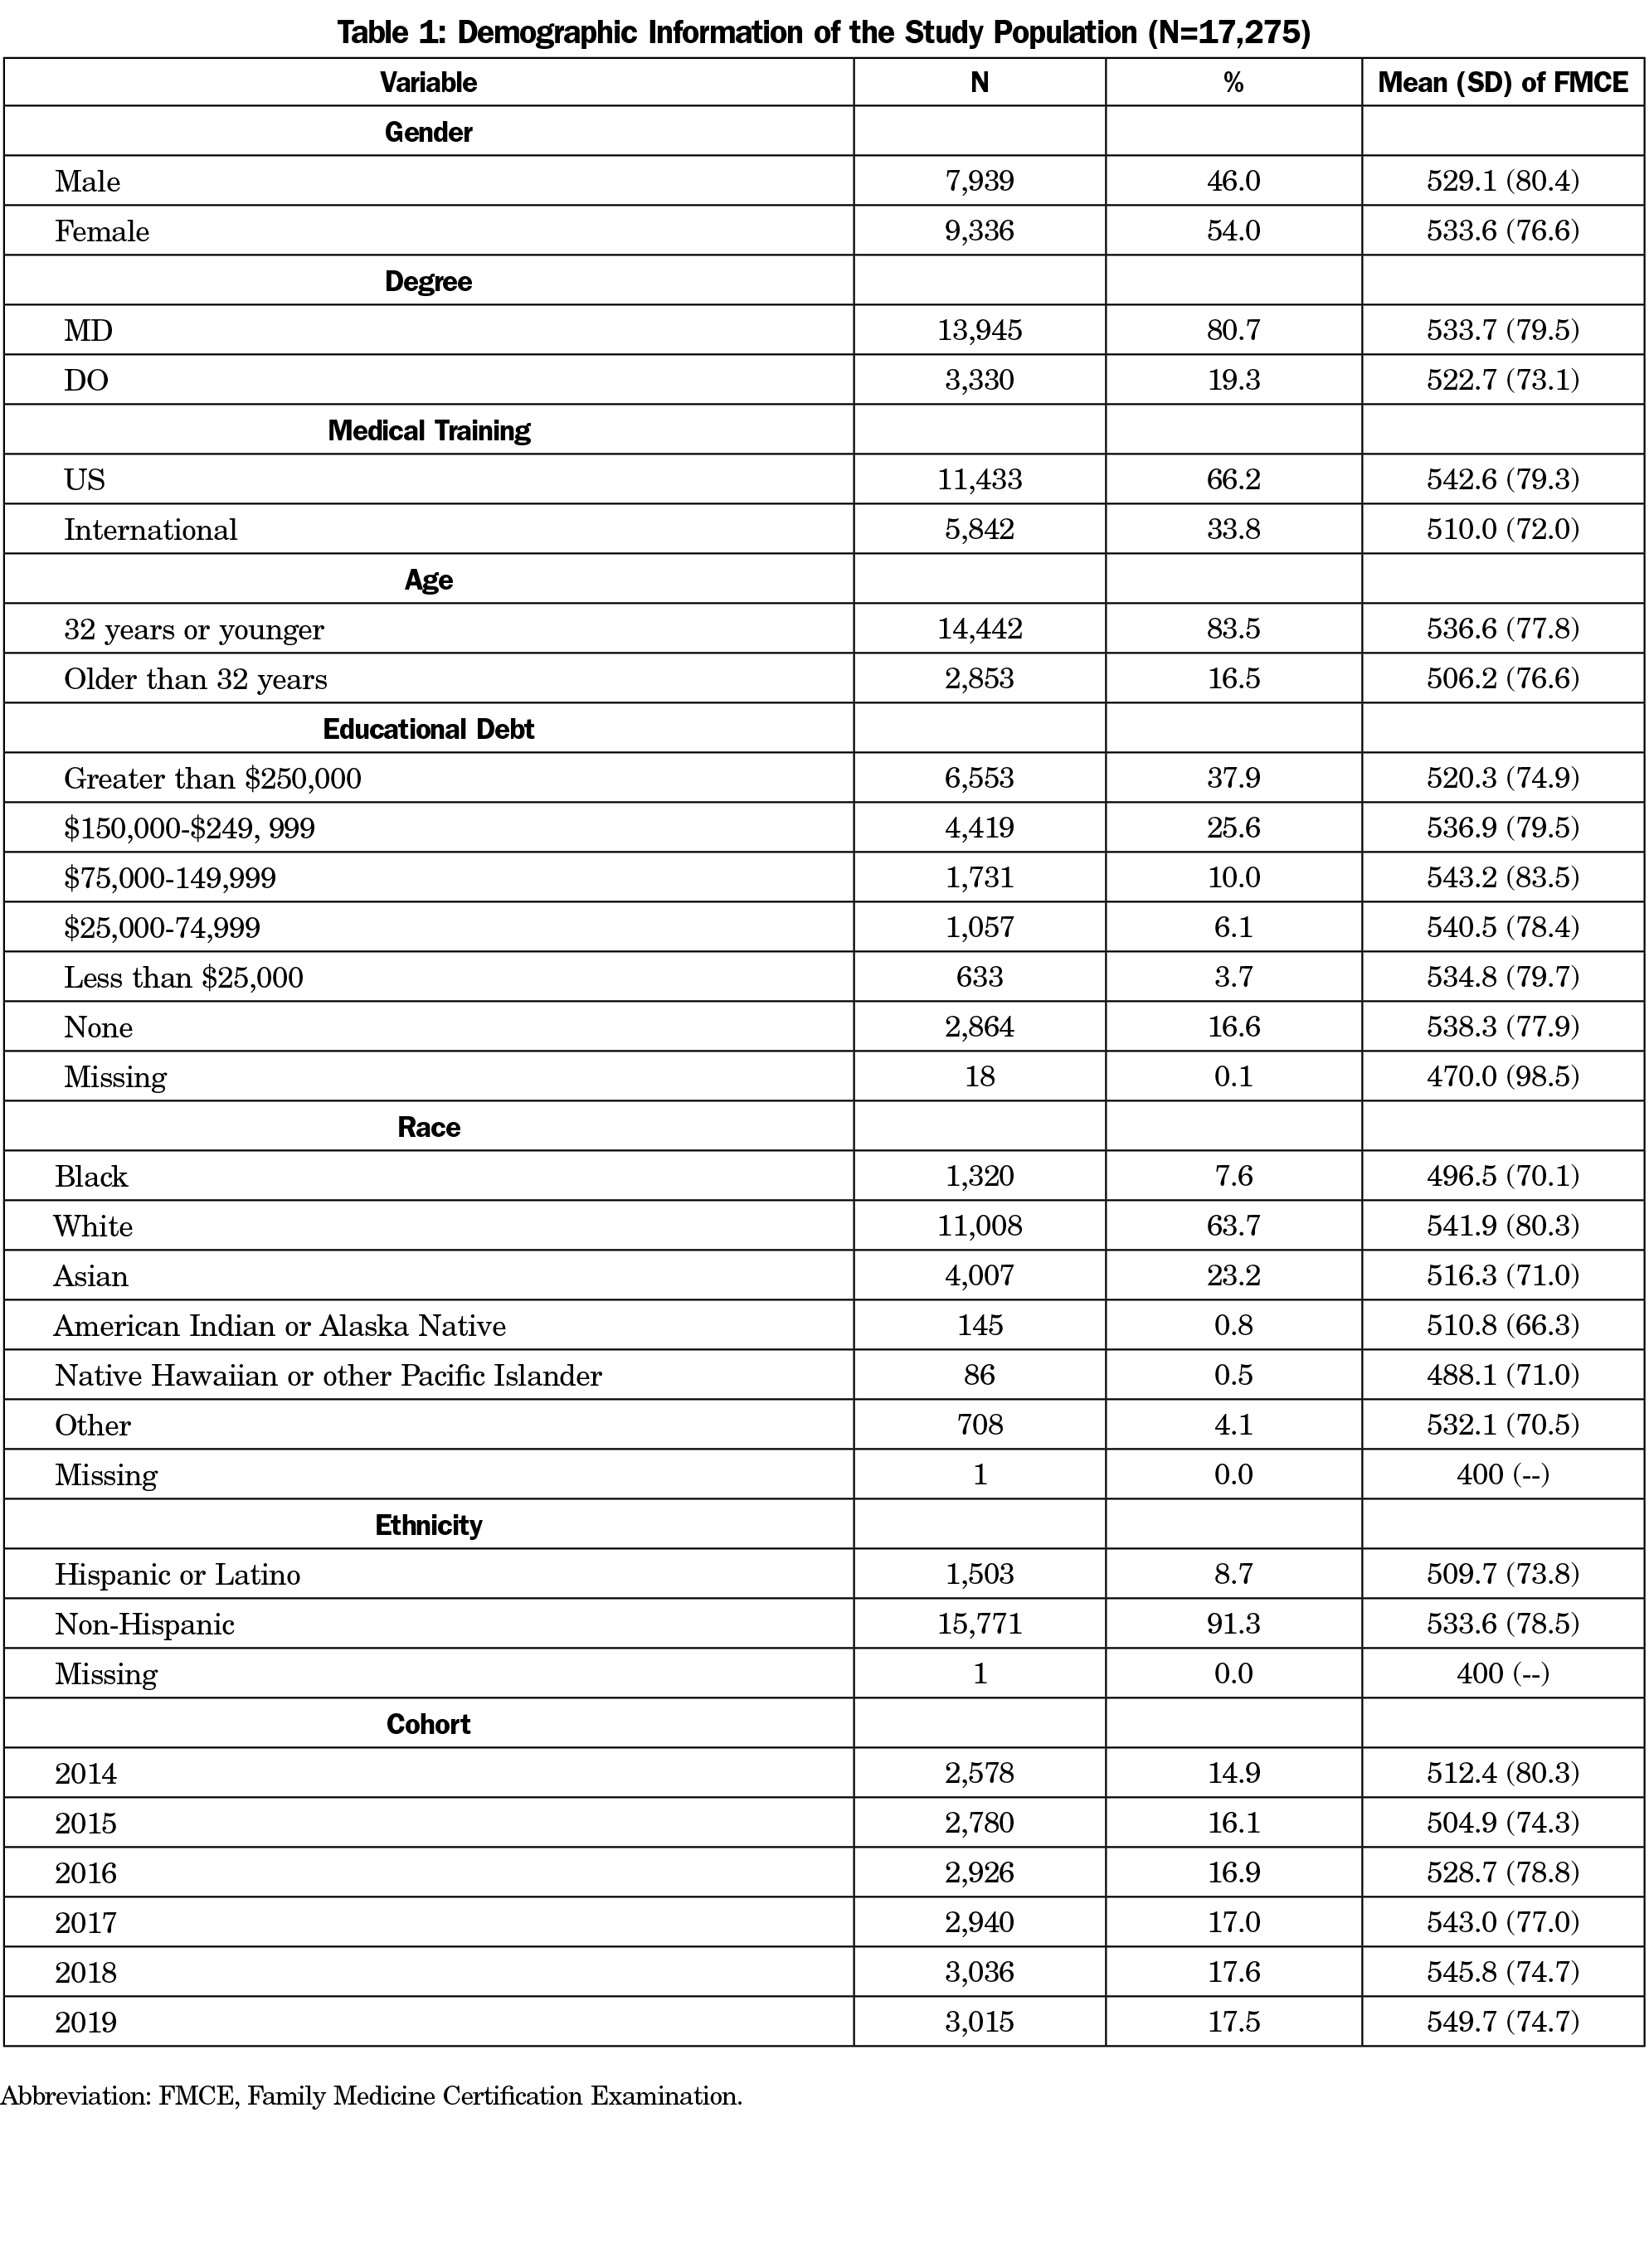
A total of 17,275 residents were included in the analysis, with 2,804 residents being excluded due to an irregular progression pattern as described above. The demographic characteristics and the scaled scores of the FMCE for the study population are summarized in Table 1. Associations of medical degree, gender, age, debt status and medical school training were all consistent with previous findings.10 The only difference is that we treated age as a dichotomous variable (younger or older than 32 years when they took the PGY1) instead of continuous in this study, due to the narrow range of residents’ age. We chose 32 years as the cutoff because the average age of residents taking the certification exam is 32.8 years, based on a previous study.10
FMCE scaled score comparison by race and ethnicity are also shown in Table 1. White residents had somewhat higher scaled scores (542.6) than their counterparts in minority groups (F=133.1, P<.001), including Black (496.5), Asian (516.3), American Indian or Alaska Native (510.8), Native Hawaiian or other Pacific Islander (488.1), and Other (532.1). Hispanic or Latino residents scored lower than the non-Hispanic group (509.7 vs 533.6; mean difference 95% confidence estimate [-27.8, -20.0], P<.001).
Initial Score Disparity at PGY1
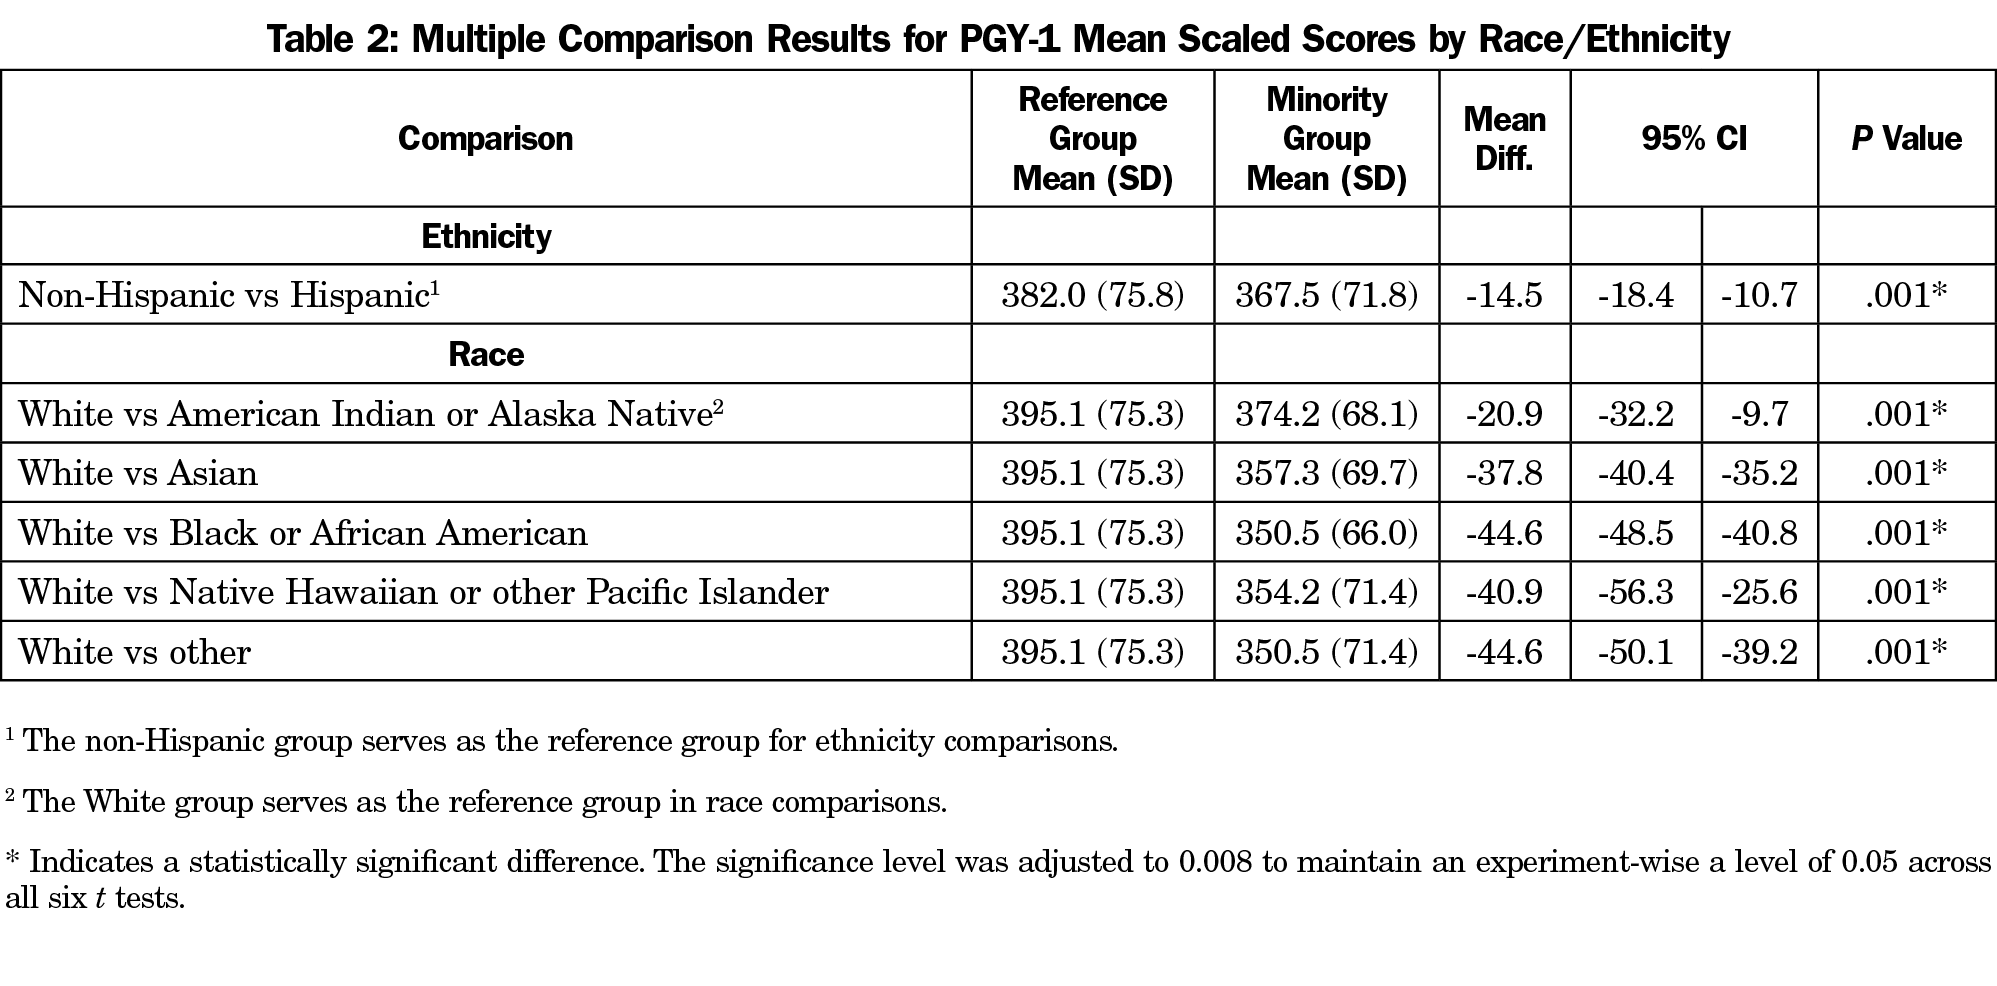
Table 2 shows that there is a statistically significant score difference between the reference group and the minority groups, with the reference group consistently scoring somewhat higher than the minority groups. The magnitude of the difference ranges from -14.5 (Hispanic vs non-Hispanic) to -44.6 (Black vs White; other vs White). We defined a meaningful difference as half of the standard deviation.15 Table 2 shows that half of the standard deviation is roughly 39. The differences for Black, Native Hawaiian/other Pacific Islander, and other from White were meaningful.
Does the Disparity Persist?
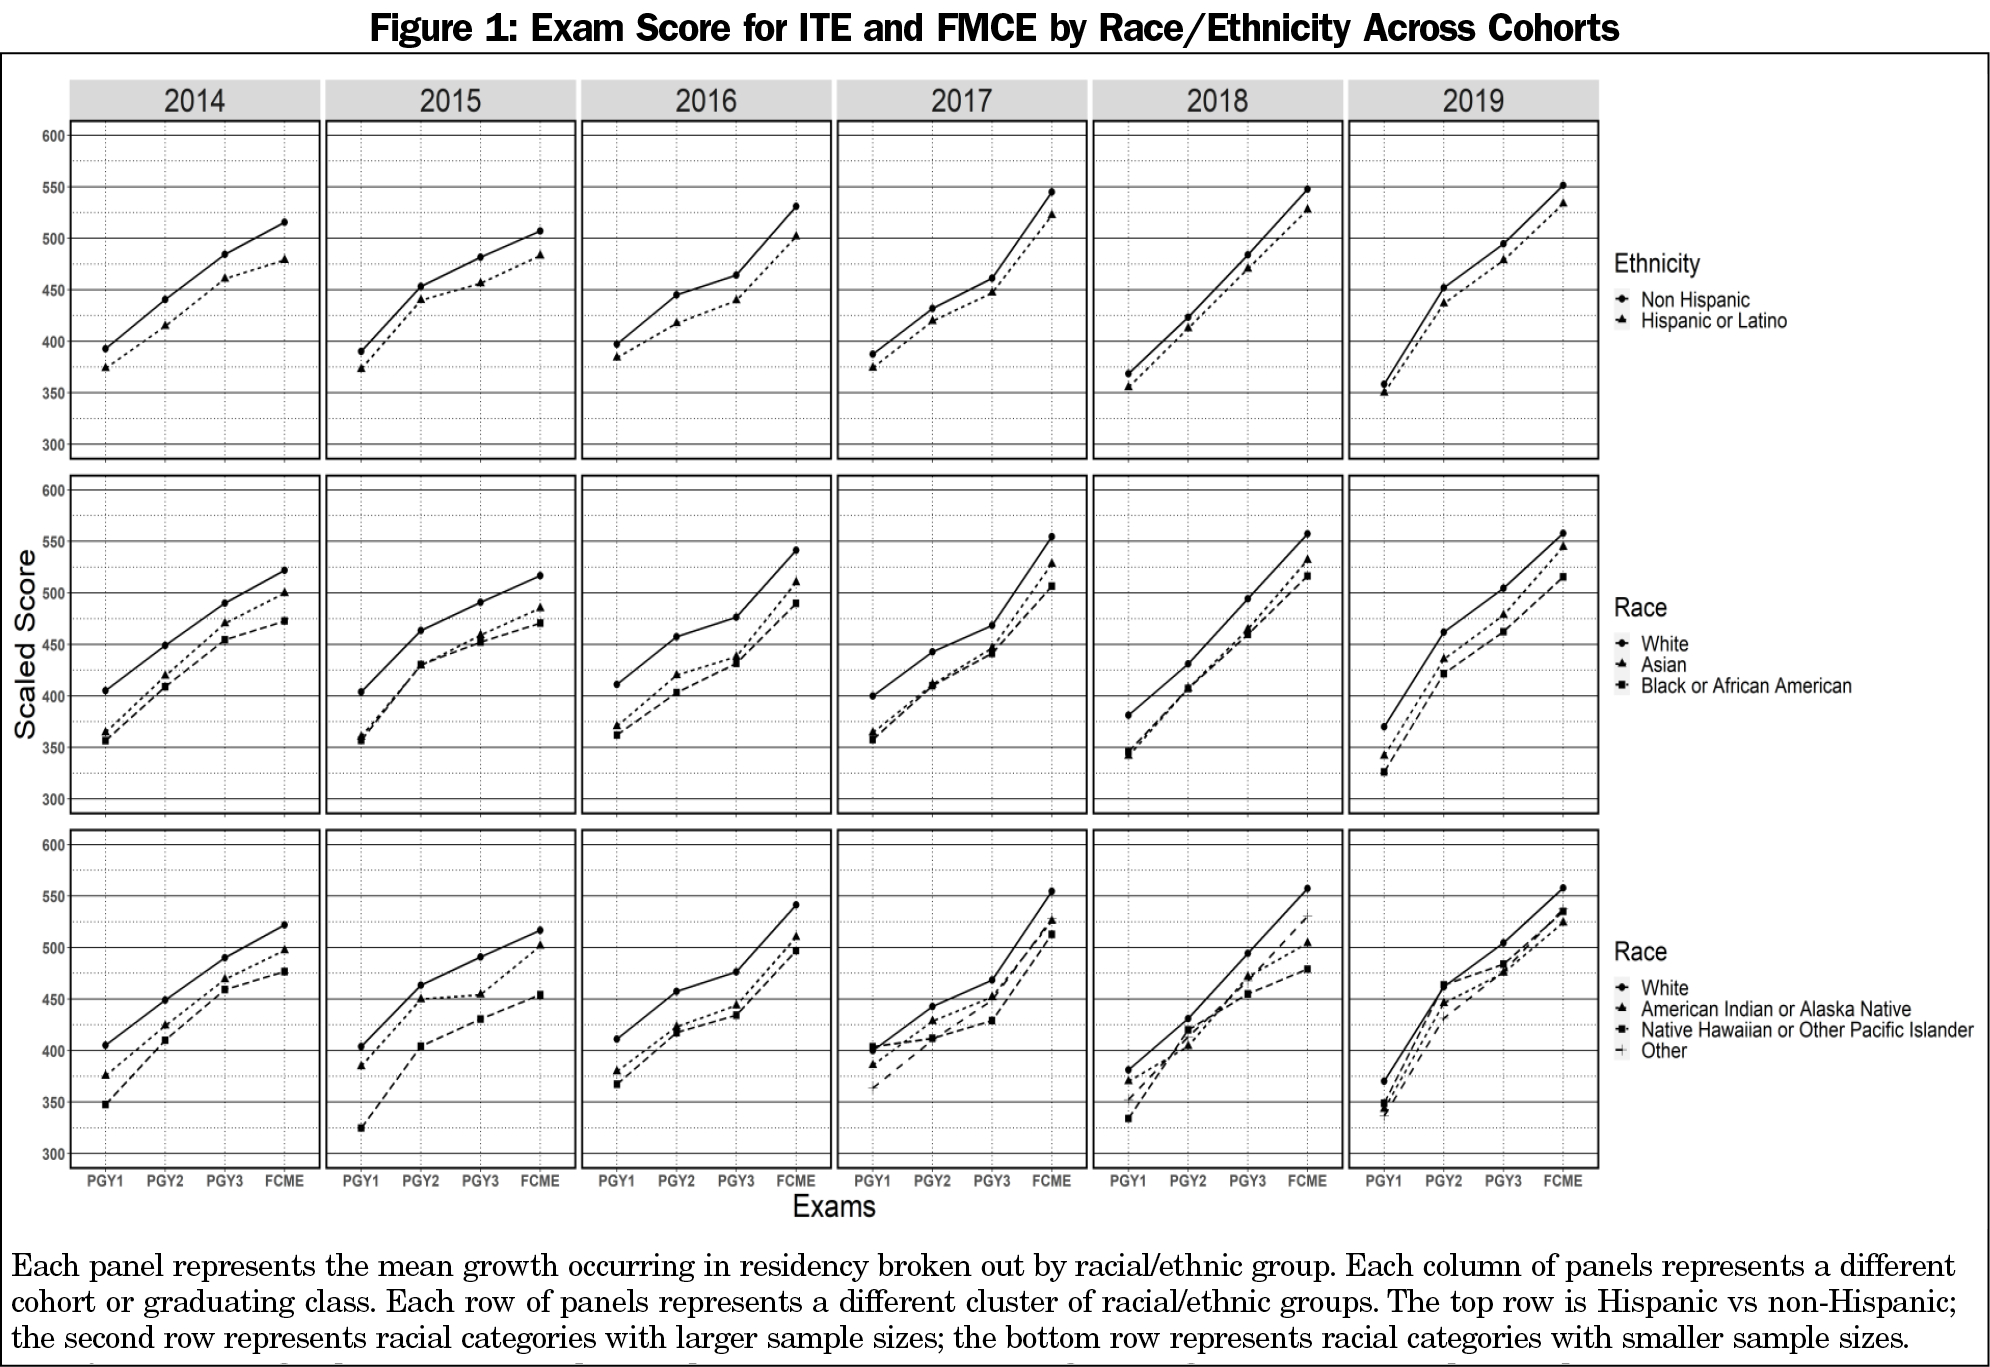
Figure 1 illustrates the results. Several general trends were evident. First, the non-Hispanic group scored higher than the Hispanic or Latino group, and the White group scored higher than the minorities from PGY1 through the FMCE across all cohorts. Second, scaled scores across all racial/ethnic groups increased from PGY1 to FMCE in an approximately linear manner. Third, the deviation from a linear pattern can be observed in racial categories with small sample sizes. For example, the nonlinear pattern noticeable in the 2015 and 2017 cohorts was due to small sample size in American Indian or Alaska Native (n=26) and Native Hawaiian or other Pacific Islander (n=11) in these cohorts.
Table 3 shows slopes across race/ethnicity utilizing a linear mixed model described in our Analysis section. Overall, slope changes across race and ethnicity were small, only a few were statistically significant, and none of them appear to be meaningful.
Does the Disparity Persist After Controlling for Covariates?
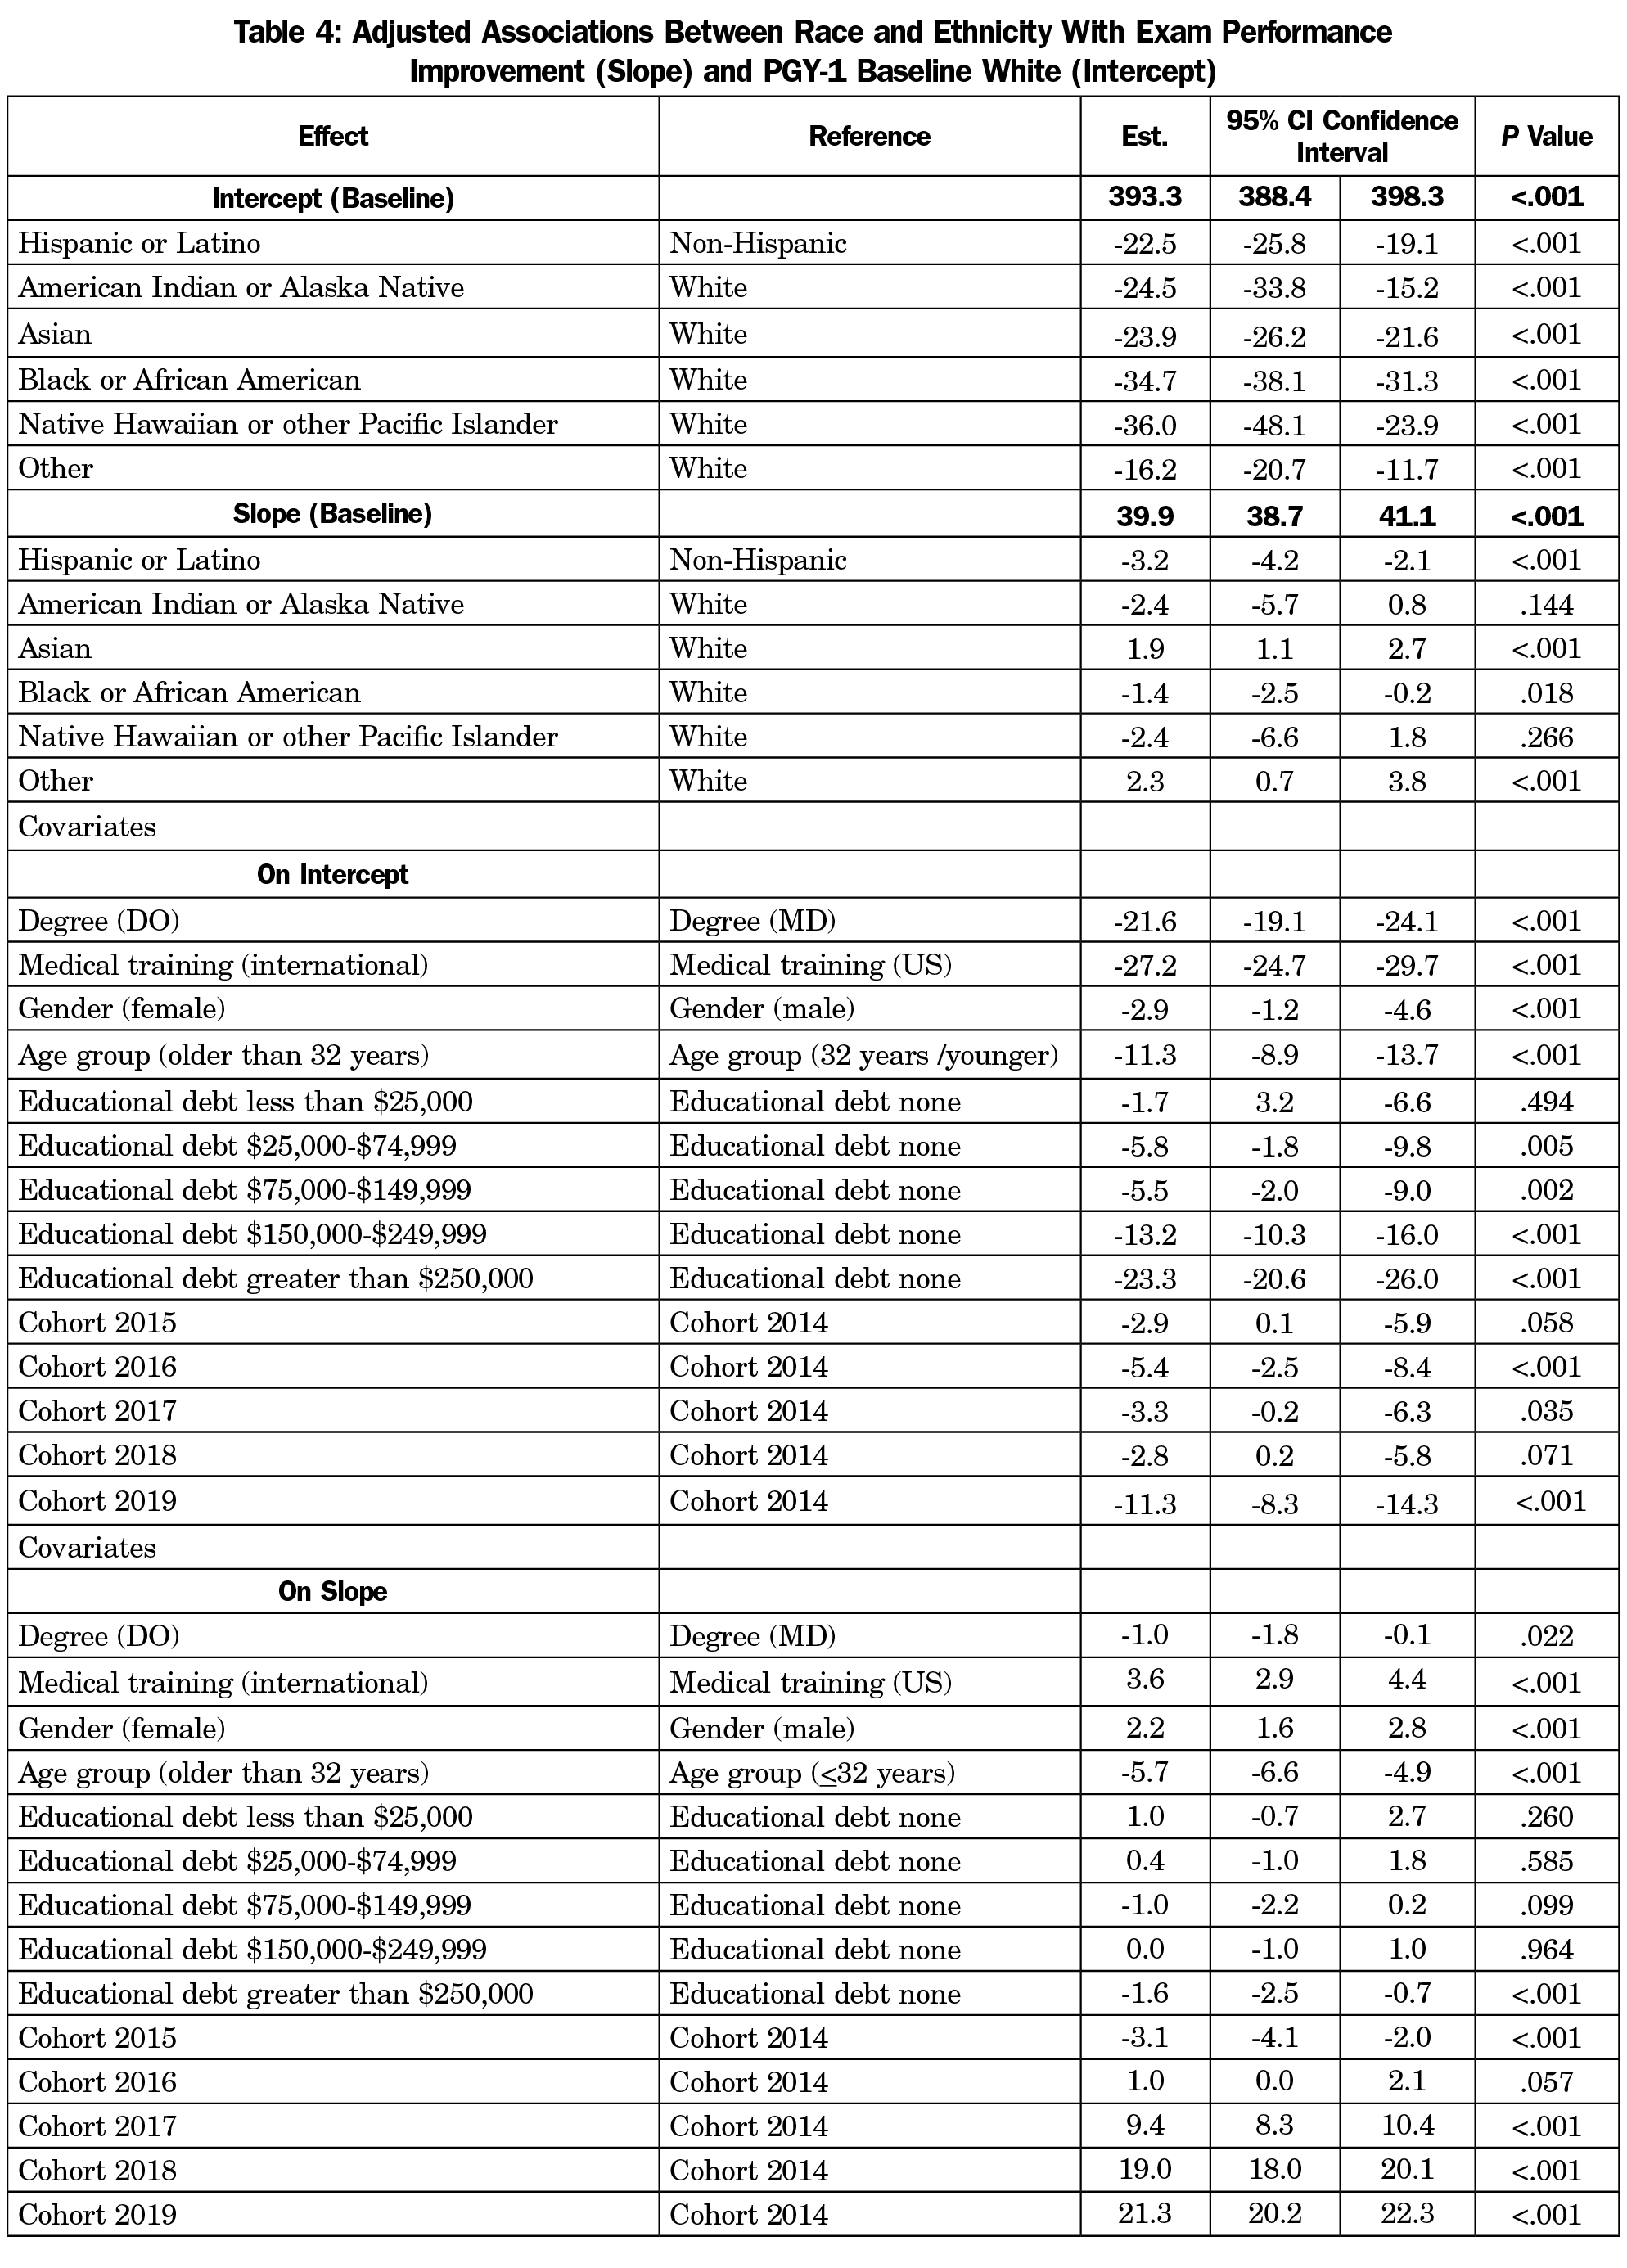
Table 4 shows the impact of race/ethnicities on intercept and slope as well as the covariates coefficients. Compared with the non-Hispanic group (reference group), the Hispanic group had significantly lower scores (-22.5; 95% CI [-25.8, -19.1]) in PGY1 (represented in intercept). Similarly, all minority racial groups have significantly lower intercepts compared with White, with the difference ranging from -16.2 (other) to -36.0 (Native Hawaiian or other Pacific Islander). Considering the slopes of the comparisons, the baseline slope showed that residents gained 39.9 points between each exam administration. Additional slope changes by race and ethnicity were statistically significant, but of very small magnitude. For example, Black residents gained 1.4 fewer points each year compared to White residents, and Hispanic residents 3.2 fewer points each year compared to non-Hispanic residents.
The association of resident characteristics with PGY-1 score (intercept) and growth in scores (slope) are also shown in Table 4. Specifically, females have lower scores in PGY1 compared with males, but had a greater increase compared to males over residency, resulting in slightly higher FMCE mean scaled scores demonstrated in Table 1. The mean scaled score difference between MD and DO are mainly caused by the difference at PGY-1, since the growth in scores between each examination for DO compared with MD is negligible (-1.0), though statistically significant. IMGs score lower than USMGs on PGY-1 ITE (-27.2), but made up some difference during residency with a higher growth in score (3.6). Older residents underperformed on the PGY-1 ITE (-11.3) and had lower growth in scores compared with younger residents (-5.7). Residents with student debt more than $250,000 were associated with lower PGY-1 ITE (-23.3) and less increase in scores (-1.6) compared with those with no debt. The cohorts from 2015-2019 generally have lower PGY-1 scores, ranging from -2.8 to -11.3, compared with cohort 2014, but their scores improved more during residency, ranging from 1.0 to 21.3 points per exam (except cohort 2015, which had lower growth compared with cohort 2014).
This study found that initial score disparities exist across race/ethnicity groups in PGY1, and they persisted throughout residency training. Because knowledge acquisition was similar across groups, it appears that residents may receive comparable postgraduate medical education regardless of race/ethnicity. Because the score differences across groups were similar to the differences found on the ITE in PGY1, it is important to consider the disparity from an educational pipeline perspective and recognize the influence that the complex and deeply-embedded influences of structural racism hold over the preresidency pipeline.16
As shown in a study of USMLE Step 1 scores, racial/ethnic disparities for Black and Latino students were largely explained by differences in MCAT scores and undergraduate performance.17 Looking back further along the educational pipeline, researchers have found that MCAT scores and undergraduate performance gaps were associated with neighborhood and family characteristics, such as continuity and quality of education, familial income (poverty), parents’ education, and household structure (single parent household vs both parents household).6,18 These associations are related to numerous overtly and implicitly racist policies that are built in to all levels of legal, social, educational, and economic structures in the United States, including mass Black male incarceration,19 de facto racial segregation, redlining neighborhoods, predatory lending practices, as well as funding based on taxable income, which all perpetuate generational cycles of discrimination and oppression, and hinder wealth accumulation.20 Therefore, it is essential to enhance minority students’ academic preparedness along the educational pipeline as early as possible and restructure how resources are allocated, such as precollege and prematriculation outreach programs to help students overcome the gaps in their academic preparation.21 It has been demonstrated in a Caribbean school case study that premedical programs targeting medical education readiness could enhance the competitiveness of minority students’ medical school applications.22 The University of North Carolina Medical Education Development (MED) program has provided intensive academic and test skills preparation for admission to medical and dental schools since 1974. Between 1974 and 2001, 85.7% of the MED participants earned MD degrees successfully despite having significantly lower MCAT scores and undergraduate grade point averages. More importantly, the success rate is comparable among race and ethnicity. The effectiveness of the MED program suggests that an intensive, 9-week, premedical academic enrichment program can help disadvantaged students substantially.23,24 If such academic enrichment programs, along with peer support and small group tutoring, could be provided in the K-12 educational stage, the academic preparedness gap could be reduced as early as fourth through eighth grade.24
While maintaining, rather than widening, the performance gap among minority race/ethnicity residents is encouraging, medical school education and residency training should be actively working to close the performance gap shown in PGY1. As our study’s results demonstrate, a typical resident’s score would increase 39.9 points per year, approximate to the widest initial score disparity of 44.6 (shown between the Black and White group without adjusting covariates). If this initial score disparity can be addressed with additional training before medical school matriculation, residents from all races/ethnicities would start residency with comparable preparedness. For example, mentoring, specialized coursework, structured clinical experience, and advanced independent study have been provided by the University of California since 2007 to support medical students from underrepresented groups.25 Another alternative is to accelerate minority students’ knowledge acquisition speed during residency with more constructive feedback. As stated in the introduction, IMG pass rates increased faster than those of USMGs, after the implementation of a Bayesian Score Predictor (BSP).11 The BSP permitted program directors to identify residents who needed additional support in a timely manner. If additional tools could be created to identify specific deficits in clinical knowledge early in residency, residents with less academic preparedness would be better supported. In addition to developing clinical expertise, confidence-building and social support are important to minority students’ mental well-being. For example, specific training on implicit bias and antiracism curriculum integration have been found to enhance faculty and students’ awareness of their own implicit biases and how these biases may affect their behavior toward members of minority groups.26–28 This type of training could potentially reduce minority residents’ self-doubt29 and high prevalence of burnout.30 If the performance gap is closed during residency training, the pool of underrepresented minority applicants for faculty positions may increase, which could increase the number of URMs available to serve as mentors or role models to future classes of underrepresented students.31
Our analysis included several covariates other than race and ethnicity that are known to affect performance on certification examinations.10 Score differences were present at the PGY-1 level across gender, age, educational debt, country of medical training, and type of medical degree. Although the impact of those covariates on growth is statistically significant, it is not meaningful. The impact of the adjustments upon the mean growth from one administration to the next was small, less than 6.0 scaled score points for each group on a scale that ranges from 200 to 800. The size of this adjustment was only 7% of the standard deviation of the scores used in this study. This suggests that there is a comparable speed of knowledge acquisition. The only meaningful slope difference appeared in cohort 2018 through cohort 2019, implying that there was accelerated knowledge acquisition in recent cohorts.
This study has several limitations. First, this study is limited to family medicine training and may not apply to other specialties. Second, the race/ethnicity options were “select best” and may not reflect the complicated reality of racial identification. In terms of covariates, ABFM does not collect rurality or income status of the residents’ family of origin, which are associated with score disparity.8,32 Moreover, the participants’ selection criterion used in this study disregarded racial/ethnicity disparity in residency withdrawn/dismissed rates.33 Finally, medical knowledge assessment was confined to exam performance.
In conclusion, this study found different starting points, but similar trajectories of medical knowledge acquisition of residents in family medicine across races and ethnicities, providing evidence for race/ethnicity equality in family medicine residency training, but also for an ongoing need to progress toward equity in training.
References
- Taylor ED, Pelika S, Coons A. To What Extent Are Ethnic Minority Teacher Candidates Adversely Affected by High-Stakes Assessments? NEA Research Brief. NBI No. 16. National Education Association. Published online 2017.
- Klein SP. Disparities in Bar Exam Passing Rates among Racial/Ethnic Groups: Their Size, Source, and Implications. T Marshall L Rev. 1990;16:517.
- Pennock‐Román M. Differences Among Racial and Ethnic Groups in Mean Scores on the GRE and SAT: Cross-Sectional Comparisons. ETS Research Report Series. 1991;1991(1):i-12. doi:10.1002/j.2333-8504.1991.tb01379.x
- Dixon-Román EJ, Everson HT, McArdle JJ. Race, poverty and SAT scores: modeling the influences of family income on black and white high school students’ SAT performance. Teach Coll Rec. 2013;115(4):1-33. doi:10.1177/016146811311500406
- Camara WJ, Schmidt AE. Group Differences in Standardized Testing and Social Stratification. Report No. 99-5. 1999.
- Davis D, Dorsey JK, Franks RD, Sackett PR, Searcy CA, Zhao X. Do racial and ethnic group differences in performance on the MCAT exam reflect test bias? Acad Med. 2013;88(5):593-602. doi:10.1097/ACM.0b013e318286803a
- Rubright JD, Jodoin M, Barone MA. Examining demographics, prior academic performance, and United States Medical Licensing Examination scores. Acad Med. 2019;94(3):364-370. doi:10.1097/ACM.0000000000002366
- Barton PE, Coley RJ. Parsing the Achievement Gap II. Policy Information Report. Educational Testing Service. Published online 2009.
- Accreditation Council for Graduate Medical Education. ACGME Program Requirements for Graduate Medical Education in Family Medicine. Chicago, IL: Accreditation Council for Graduate Medical Education; 2017. Accessed November 29, 2021. http://www.acgme.org/Portals/0/PFAssets/ProgramRequirements/120_family_medicine_2017-07-01.pdf
- Phillips JP, Peterson LE, Kovar-Gough I, O'Neill TR, Peabody MR, Phillips RL. Family Medicine Residents' Debt and Certification Examination Performance. PRiMER. 2019;3:7. doi: 10.22454/PRiMER.2019.568241
- Puffer JC, Peabody MR, O’Neill TR. Performance of graduating residents on the American Board of Family Medicine Certification Examination 2009-2016. J Am Board Fam Med. 2017;30(5):570-571. doi:10.3122/jabfm.2017.05.170065
- Norris TE, Rovinelli RJ, Puffer JC, Rinaldo J, Price DW. From specialty-based to practice-based: a new blueprint for the American Board of Family Medicine cognitive examination. J Am Board Fam Pract. 2005;18(6):546-554. doi:10.3122/jabfm.18.6.546
- O’Neill TR, Li Z, Peabody MR, Lybarger M, Royal K, Puffer JC. The predictive validity of the ABFM’s In-Training Examination. Fam Med. 2015;47(5):349-356.
- O’Neill TR, Peabody MR, Song H. The predictive validity of the National Board of Osteopathic Medical Examiners’ COMLEX-USA Examinations with regard to outcomes on American Board of Family Medicine Examinations. Acad Med. 2016;91(11):1568-1575. doi:10.1097/ACM.0000000000001254
- Norman GR, Sloan JA, Wyrwich KW. Interpretation of changes in health-related quality of life: the remarkable universality of half a standard deviation. Medical care. Published online 2003:582-592. doi:10.1097/01.MLR.0000062554.74615.4C
- Lucey CR, Saguil A. The consequences of structural racism on MCAT scores and medical school admissions: the past is prologue. Acad Med. 2020;95(3):351-356. doi:10.1097/ACM.0000000000002939
- Dawson B, Iwamoto CK, Ross LP, Nungester RJ, Swanson DB, Volle RL. Performance on the National Board of Medical Examiners. Part I Examination by men and women of different race and ethnicity. JAMA. 1994;272(9):674-679. doi:10.1001/jama.1994.03520090038016
- Fadem B, Schuchman M, Simring SS. The relationship between parental income and academic performance of medical students. Acad Med. 1995;70(12):1142-1144. doi:10.1097/00001888-199512000-00019
- Dixon P. Marriage among African Americans: what does the research reveal? J Afr Am Stud. 2009;13(1):29-46. doi:10.1007/s12111-008-9062-5
- Warde B. Why race still matters 50 years after the enactment of the 1964 Civil Rights Act. J Afr Am Stud. 2014;18(2):251-259. doi:10.1007/s12111-013-9264-3
- Carline JD, Patterson DG, Davis LA, Irby DM, Oakes-Borremo P. Precollege enrichment programs intended to increase the representation of minorities in medicine. Acad Med. 1998;73(3):288-298. doi:10.1097/00001888-199803000-00018
- DeCarvalho H, Lindner I, Sengupta A, Rajput V, Raskin G. Enhancing medical student diversity through a premedical program: A Caribbean school case study. Educ Health (Abingdon). 2018;31(1):48-51. doi:10.4103/1357-6283.239047
- Keith L, Hollar D. A social and academic enrichment program promotes medical school matriculation and graduation for disadvantaged students. Educ Health (Abingdon). 2012;25(1):55-63. doi:10.4103/1357-6283.99208
- Gordon EW. Closing the Gap: High Achievement for Students of Color. AERA Research Points, Volume 2, Issue 3, Fall 2004. American Educational Research Association. Published online 2004.
- Talamantes E, Henderson MC, Fancher TL, Mullan F. Closing the gap—making medical school admissions more equitable. N Engl J Med. 2019;380(9):803-805. doi:10.1056/NEJMp1808582
- Sherman MD, Ricco J, Nelson SC, Nezhad SJ, Prasad S. Implicit bias training in a residency program: aiming for enduring effects. Fam Med. 2019;51(8):677-681. doi:10.22454/FamMed.2019.947255
- Metzl JM, Hansen H. Structural competency: theorizing a new medical engagement with stigma and inequality. Soc Sci Med. 2014;103:126-133. doi:10.1016/j.socscimed.2013.06.032
- Hardeman RR, Burgess D, Murphy K, et al. Developing a medical school curriculum on racism: Multidisciplinary, multiracial conversations informed by Public Health Critical Race Praxis (PHCRP). Ethn Dis. 2018;28(suppl 1):271-278. doi:10.18865/ed.28.S1.271
- Liebschutz JM, Darko GO, Finley EP, Cawse JM, Bharel M, Orlander JD. In the minority: black physicians in residency and their experiences. J Natl Med Assoc. 2006;98(9):1441-1448.
- Dyrbye L, Herrin J, West CP, et al. Association of racial bias with burnout among resident physicians. JAMA Netw Open. 2019;2(7):e197457-e197457. doi:10.1001/jamanetworkopen.2019.7457
- Xierali IM, Nivet MA, Rayburn WF. Full-time faculty in clinical and basic science departments by sex and underrepresented in medicine status: a 40-year review. Acad Med. 2021;96(4):568-575. doi:10.1097/ACM.0000000000003925
- Matsumoto M, Inoue K, Kajii E. Characteristics of medical students with rural origin: implications for selective admission policies. Health Policy. 2008;87(2):194-202. doi:10.1016/j.healthpol.2007.12.006
- McDade WA. Increasing graduate medical education diversity and inclusion. J Grad Med Educ. 2019;11(6):736-738. doi:10.4300/JGME-D-19-00760.1


There are no comments for this article.