Background and Objectives: Board certification is acknowledged as the mainstay for ensuring quality physician-delivered health care within medical specialties. The American College of Osteopathic Family Physicians (ACOFP) administers the American Osteopathic Board of Family Physicians’ (AOBFP) In-Service Examination (ISE) to provide residents and program directors with a formative examination to assess competency and preparation for successful completion of the AOBFP certifying examination (CE). Unique assessment processes are integral to monitoring development of the osteopathic family physician throughout training and into practice, and to verify their competency for the safety and protection of the public. This study sought to investigate whether performance on the AOBFP ISE predicted performance on the AOBFP CE, and thereby successfully equipped residents to safely enter medical practice.
Methods: In 2020, data from 1,893 PGY-1 through PGY-3 residents (2016-2018), whose ISE scores could be matched with scores on the AOBFP initial board CE, were analyzed for this study.
Results: Correlations among ISE administrations across 3 years of postgraduate medical education were in the mid-to-high .6 range; the ISE scores correlated with CE scores in the mid .4 to high .5 range. Less reliable measures of positive predictive value were 0.99, and sensitivity was 0.91.
Conclusions: Results suggest that ISE administrations during residency training are effective in developing remediation strategies for subsequent successful CE performance. The inclusion of osteopathic principles in the AOBFP CE necessitates inclusion of osteopathic content in resident training exams like ISE.
Medical education in the United States has included two separate pathways since 1892: DO degree-granting and MD degree-granting programs. Historically, MD medical students have far outnumbered DO students. With escalating demand for physicians in the United States osteopathic medical schools have flourished. Presently, 25% of medical students are enrolled in osteopathic programs.1 Osteopathic physicians number 114,428 and are expected to comprise 20% of the US physician population by 2030.2 Additionally, osteopathic physicians enter disproportionately into the primary care workforce, with 57% of DOs pursuing primary care specialties.3
In the United States, 14,500 family physicians are currently board-certified through the American Osteopathic Board of Family Physicians (AOBFP). These physicians have completed osteopathic family medicine residencies historically credentialed through the American Osteopathic Association (AOA). With the ACGME’s new single-accreditation system for graduate medical education, DOs who complete an ACGME-accredited family medicine residency, as well as MDs who meet additional osteopathic requirements, are eligible to complete residency through a family medicine program with osteopathic recognition. Within these programs, the American College of Osteopathic Family Physicians (ACOFP) produces and administers the AOBFP In-Service Examination (ISE), which is designed to provide residents and program directors with a formative examination that assesses competency and preparation for successful completion of the AOBFP certifying examination (CE).
Residency training provides the opportunity for family medicine residents to build their knowledge and develop clinical acumen via progressive assumption of responsibility in leading the medical team. Meaningful assessment occupies a vital role in this process. Performance on serial in-training residency examinations should prepare residents to successfully pass their certifying examinations and enter autonomous medical practice.
Several studies have examined the link between osteopathic assessments across the continuum from undergraduate medical examinations (UME) such as COMLEX-USA, to osteopathic assessments (and others) in GME.4-8 These studies have looked at correlations as osteopathic medical students progressed through medical education and osteopathic licensure examinations, to in-service examinations, to board certification, and to performance in practice.9
The best-known studies involve the American Board of Family Medicine (ABFM) certification examination and other medical examinations such as the ITE or COMLEX-USA. O’Neill studied the ITE scores of 9,630 residents relative to ABFM pass rates.10 They reported very high sensitivity (0.91), meaning 91% of students who passed ITE (above the twelfth percentile) went on to pass the ABFM CE. However, the specificity was 0.47, meaning only 47% of students who failed the ABFM CE (below the twelfth percentile) had previously failed ITE. The predictive value of ITE on eventual success on the ABFM CE is much stronger than its prediction of future failure. This assertion is supported by the positive predictive value (PPV) of 0.96 and the negative predictive value (NPV) of 0.27, confirming that while failing ITE is not necessarily predictive of failing the ABFM CE, passing ITE may be predictive of passing CE.
O’Neill, et al went on to study 1,065 students’ successive scores on COMLEX-USA Level 1, Level 2 CE, and Level 3 with ITE scores during each postgraduate year and ABFM CE scores.11 They again reported very high sensitivity (0.9) and PPV (0.96) alongside poor specificity (0.39) and NPV (0.19). These findings further bolster the argument that ITE and COMLEX can also identify residents most likely to ultimately pass the ABFM CE. Because the NPV and specificity for ITE and COMLEX-USA are low, we can infer that poor performance on these exams does not predict ultimate failures on ABFM CE. Most likely, residents scoring poorly on ITE and COMLEX take additional steps to further prepare prior to sitting for the ABFM exam to address knowledge deficits identified by these examinations.
Since all residents at osteopathically recognized residency programs are now eligible for board certification through osteopathic boards, the current study addresses knowledge deficits among family medicine residency program directors, as an apple-to-apple comparison to the O’Neill study. Our study reproduces the methods incorporated by the prior articles regarding the American Academy of Family Physicians (AAFP) In-Service Training Examinations and subsequent passage of the ABFM certifying examination but applied it to the Residency AOBFP In-Service Exam, produced and administered by ACOFP, in predicting performance on the AOBFP certifying exam and thereby successfully equipping osteopathic medical residents to safely enter medical practice.
Participants
In 2020, data from 1,893 residents in years PGY1-PGY3 from 2016-2018 whose ISE scores could be matched with scores on the AOBFP CE, were used for this analysis. Residents in years PGY4-PGY5 were dropped from the analyses due to insufficient sample size.
Scores for AOBFP examinees who had PGY3 ISE scores were retained for the predictive value study. This group included 1,811 examinees taking the AOBFP CE for the first time between 2017 and 2019.
Measures
The AOBFP ISE is administered online via secure servers to residents in mid fall. The examination includes 200 scorable items with 20 to 30 pretest items, but final counts vary after key validation expunges unsatisfactory items. The number of scored items on the examination forms in this study varied: 175 scored items in 2016, 168 scored items in 2017, and 184 scored items in 2018. The content is organized into 25 disciplines subsumed into 11 domains. Standard scores on the examination are number-correct scores rescaled to have a mean of 500 and a standard deviation of 100.
The AOBFP CE was a 7-hour examination comprised of 400 single-answer, multiple-choice questions covering 25 disciplines. These 400 items are scored as right or wrong using the dichotomous Rasch model, and the resulting ability estimates are converted to scaled scores that range from 200 to 800. A scaled score of 400 represents the minimum level of knowledge and skill necessary to pass the examination that was established by AOBFP. These examinations were administered during the months of April and September at Pearson Vue testing centers throughout the country.
Procedures
Correlational analyses were focused in two areas: (1) the correlation among ISE scores across the 3 years of postgraduate medical education, and (2) the correlation of ISE scores with AOBFP CE scores.
We randomly split the predictive study data set into our study set (70% for building the predictive model) and test set (30% for evaluating the model). We performed multiple logistic regression models using AOBFP CE pass/fail outcomes as the dependent variable and various combinations of the PGY-3 ISE scaled score, AOBFP CE cohort, and interactions between the scaled score and cohort as the predictors. We considered both single-level and multilevel models (using the cohort as the nesting group). We based selection criteria for the predictor model on AIC, BIC, and when applicable to the model, pseudo-R2 and intraclass correlation. The logistic regression model using only the ISE scaled score as the predictor produced the lowest AIC and BIC indices (AIC: 174.08, BIC: 184.37). Additionally, McFadden’s pseudo-R2 was .23, indicating a good model fit.12 We selected this model as our predictive model.
The National Board of Osteopathic Medical Examiners Review Board IRB#1 declared our study exempt from review (IRB00012077).
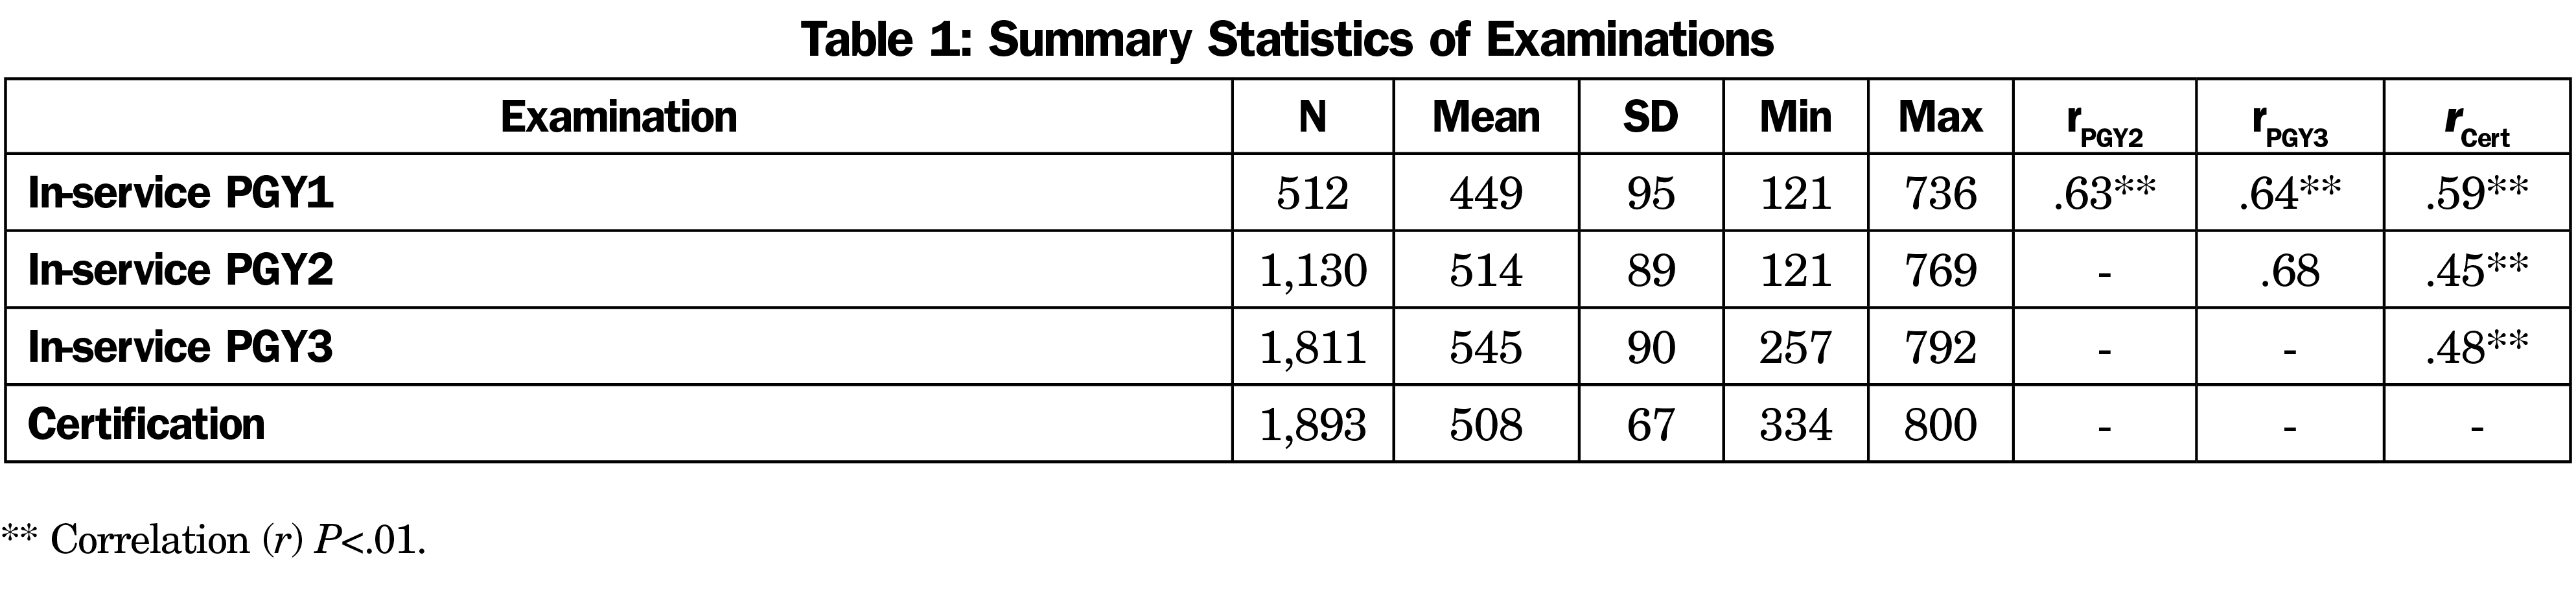
Univariate statistics for the ISE and AOBFP CE are presented in Table 1, as well as intercorrelations among the examinations across years. The examination forms had reliabilities of .86 in 2016, .84 in 2017, and .80 in 2018.
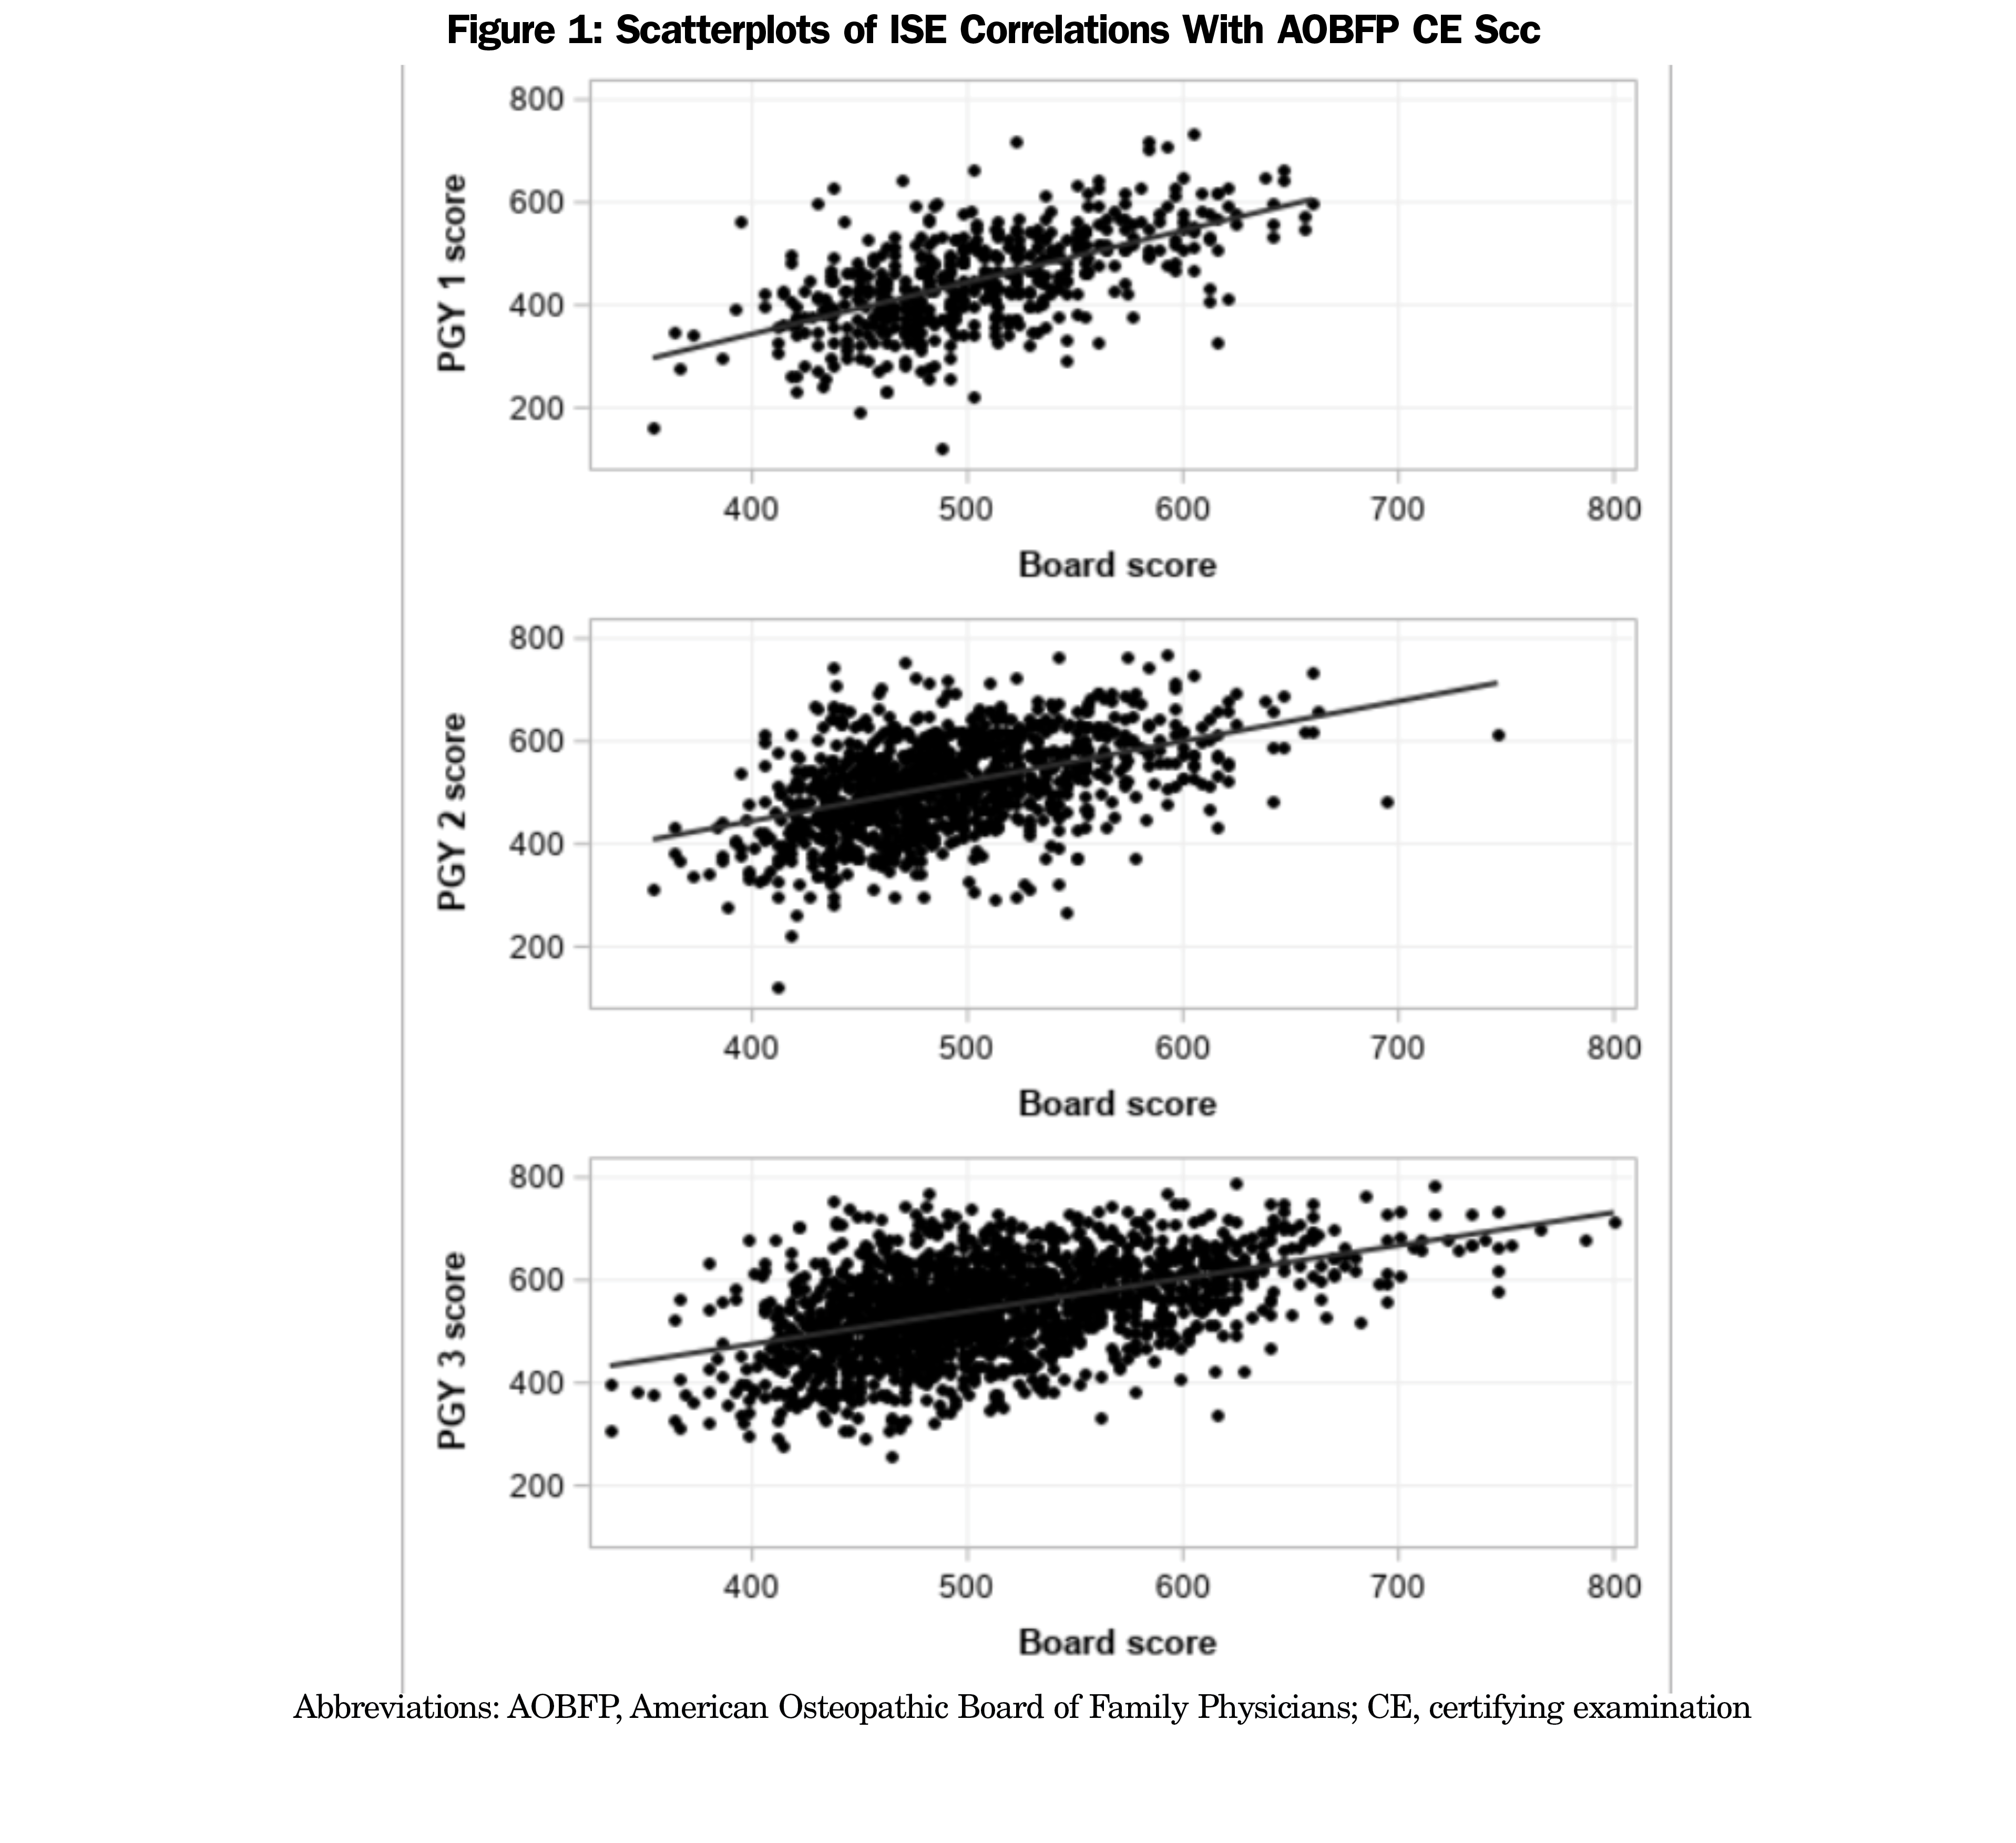
Figure 1 shows the distributions of ISE scores across years against CE scores. Of the sample, 445 candidates had available scores for all 3 years (PGY 1-3). Correlations among ISE scores across the 3 years of postgraduate medical education were in the mid to high .6 range; ISE scores correlated with AOBFP CE scores in the mid .4 to high .5 range. The biserial correlations between ISE scores and AOBFP CE scores were .44 for PGY1, .58 for PGY2, and .54 for PGY3, but the number of failing scores in the data set was very small.
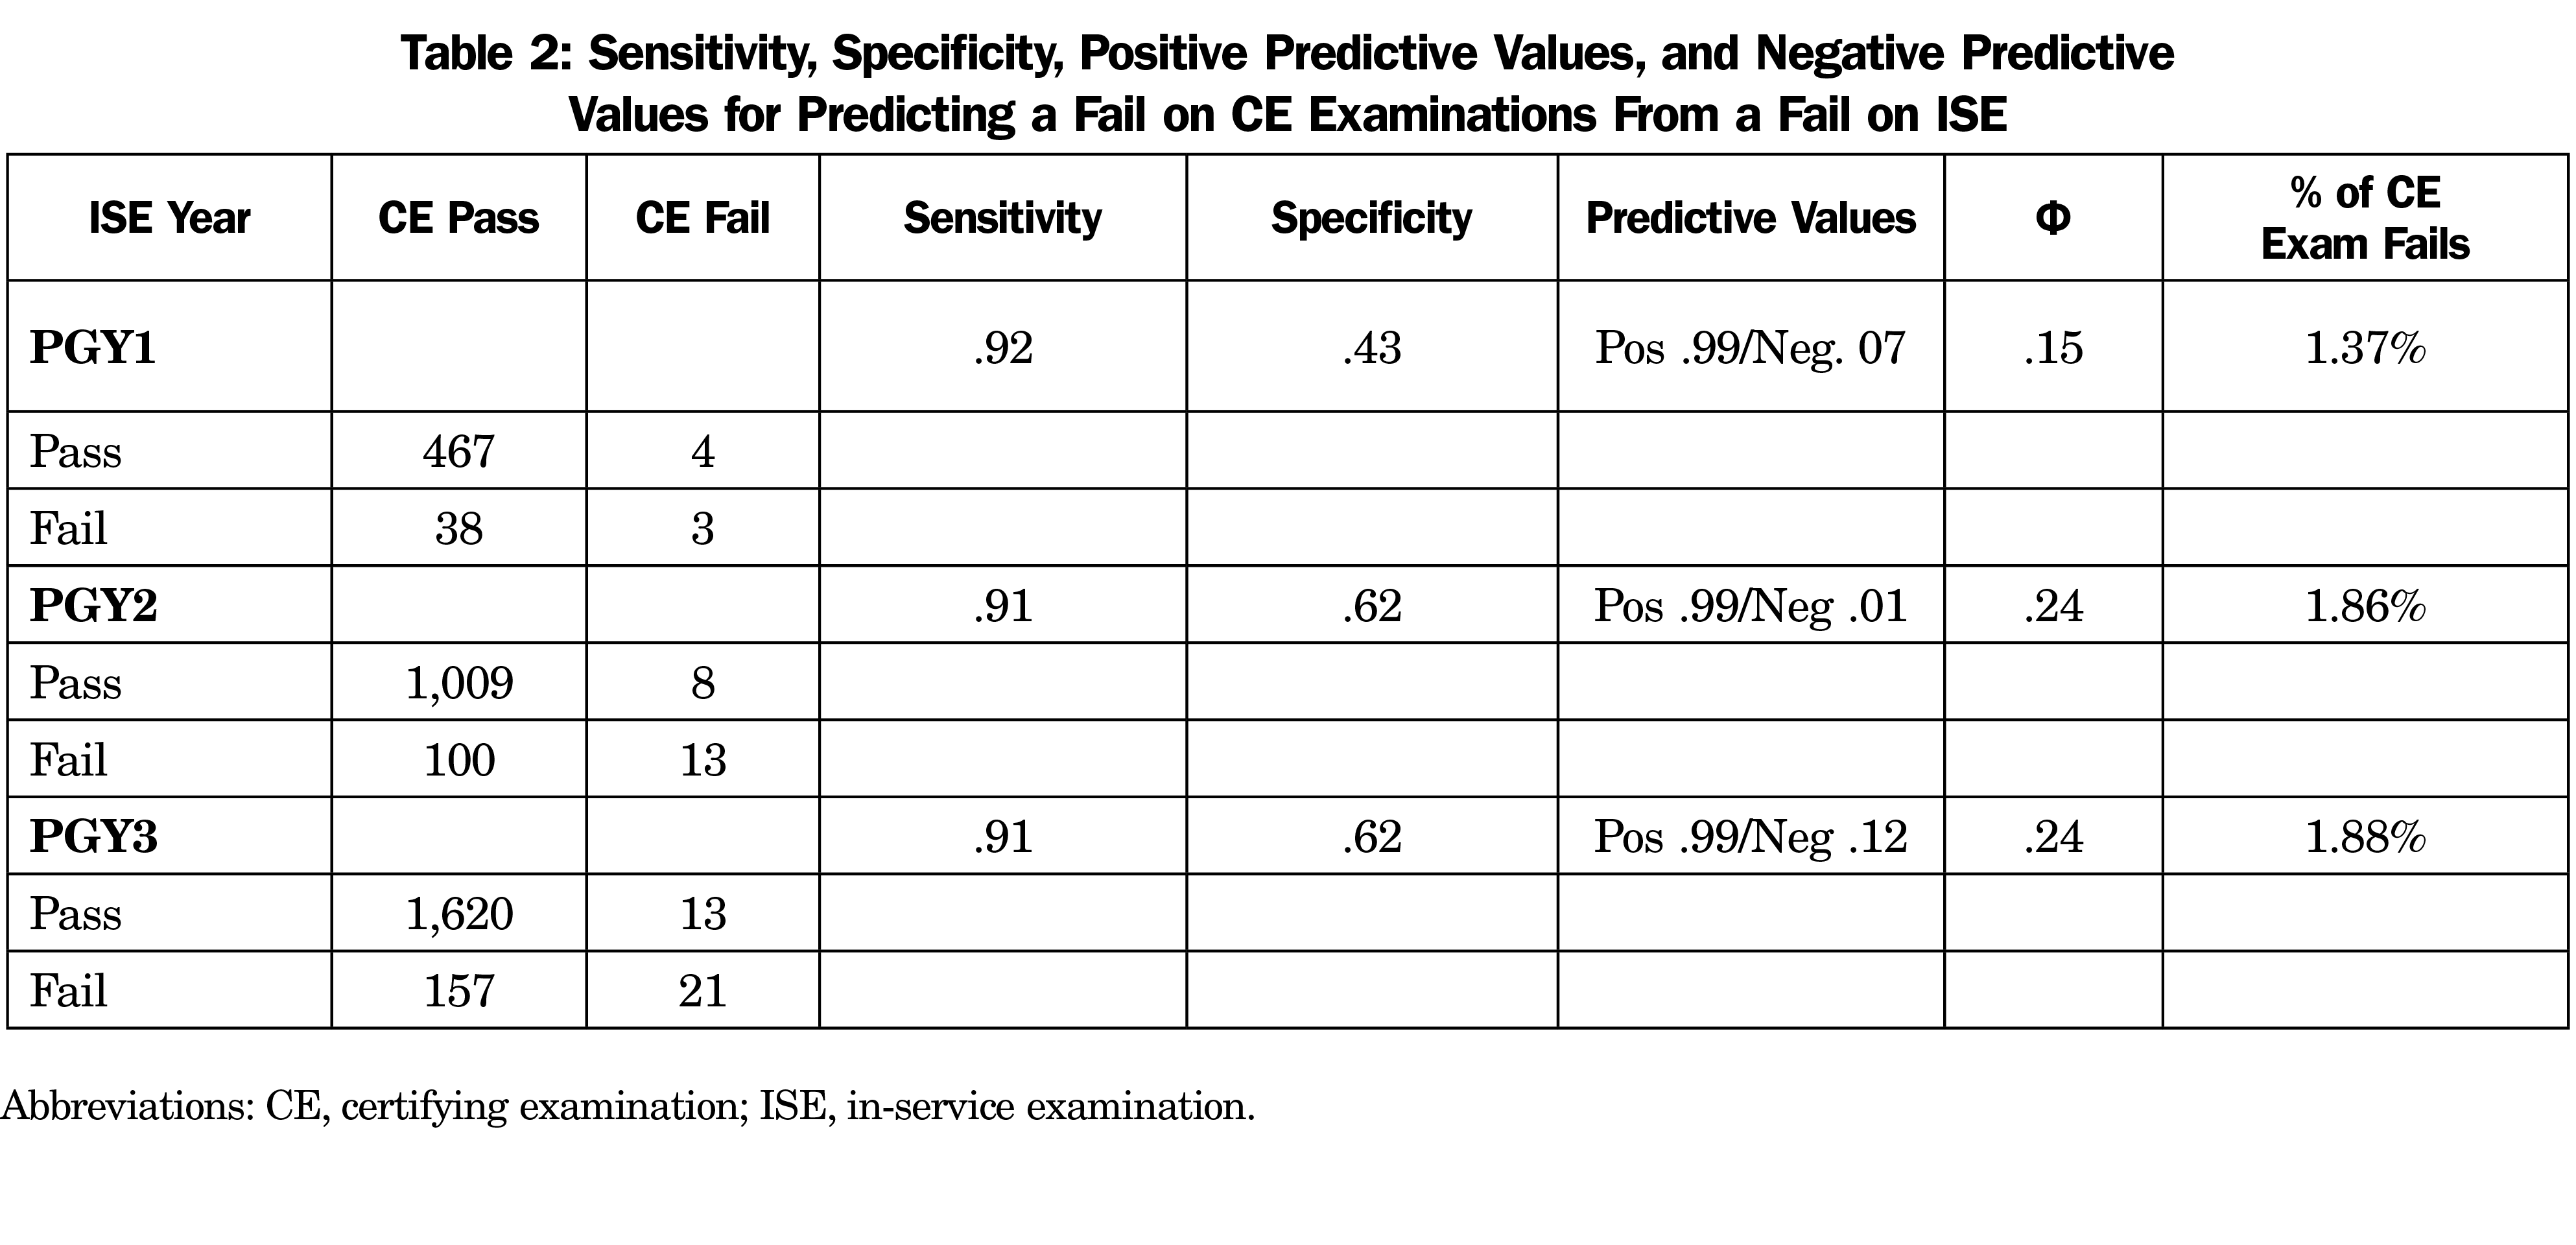
For the sensitivity and specificity analyses, a score at less than or equal to the tenth percentile on ISE was considered to be a fail. Sensitivity and specificity values are presented in Table 2, along with the respective rates of false-positive and false-negative values. In every case, the positive predictive value was over 99% and the negative predictive value was less than 15%. A prediction that a candidate would pass the CE given a pass on the ISE was almost always correct; a prediction that the candidate would fail the CE given a fail on the ISE was almost never correct. Reconciling this finding with the findings of the correlational analysis is not a matter of understanding the test; it is a matter of understanding the difficulty involved in predicting low base rate behavior.
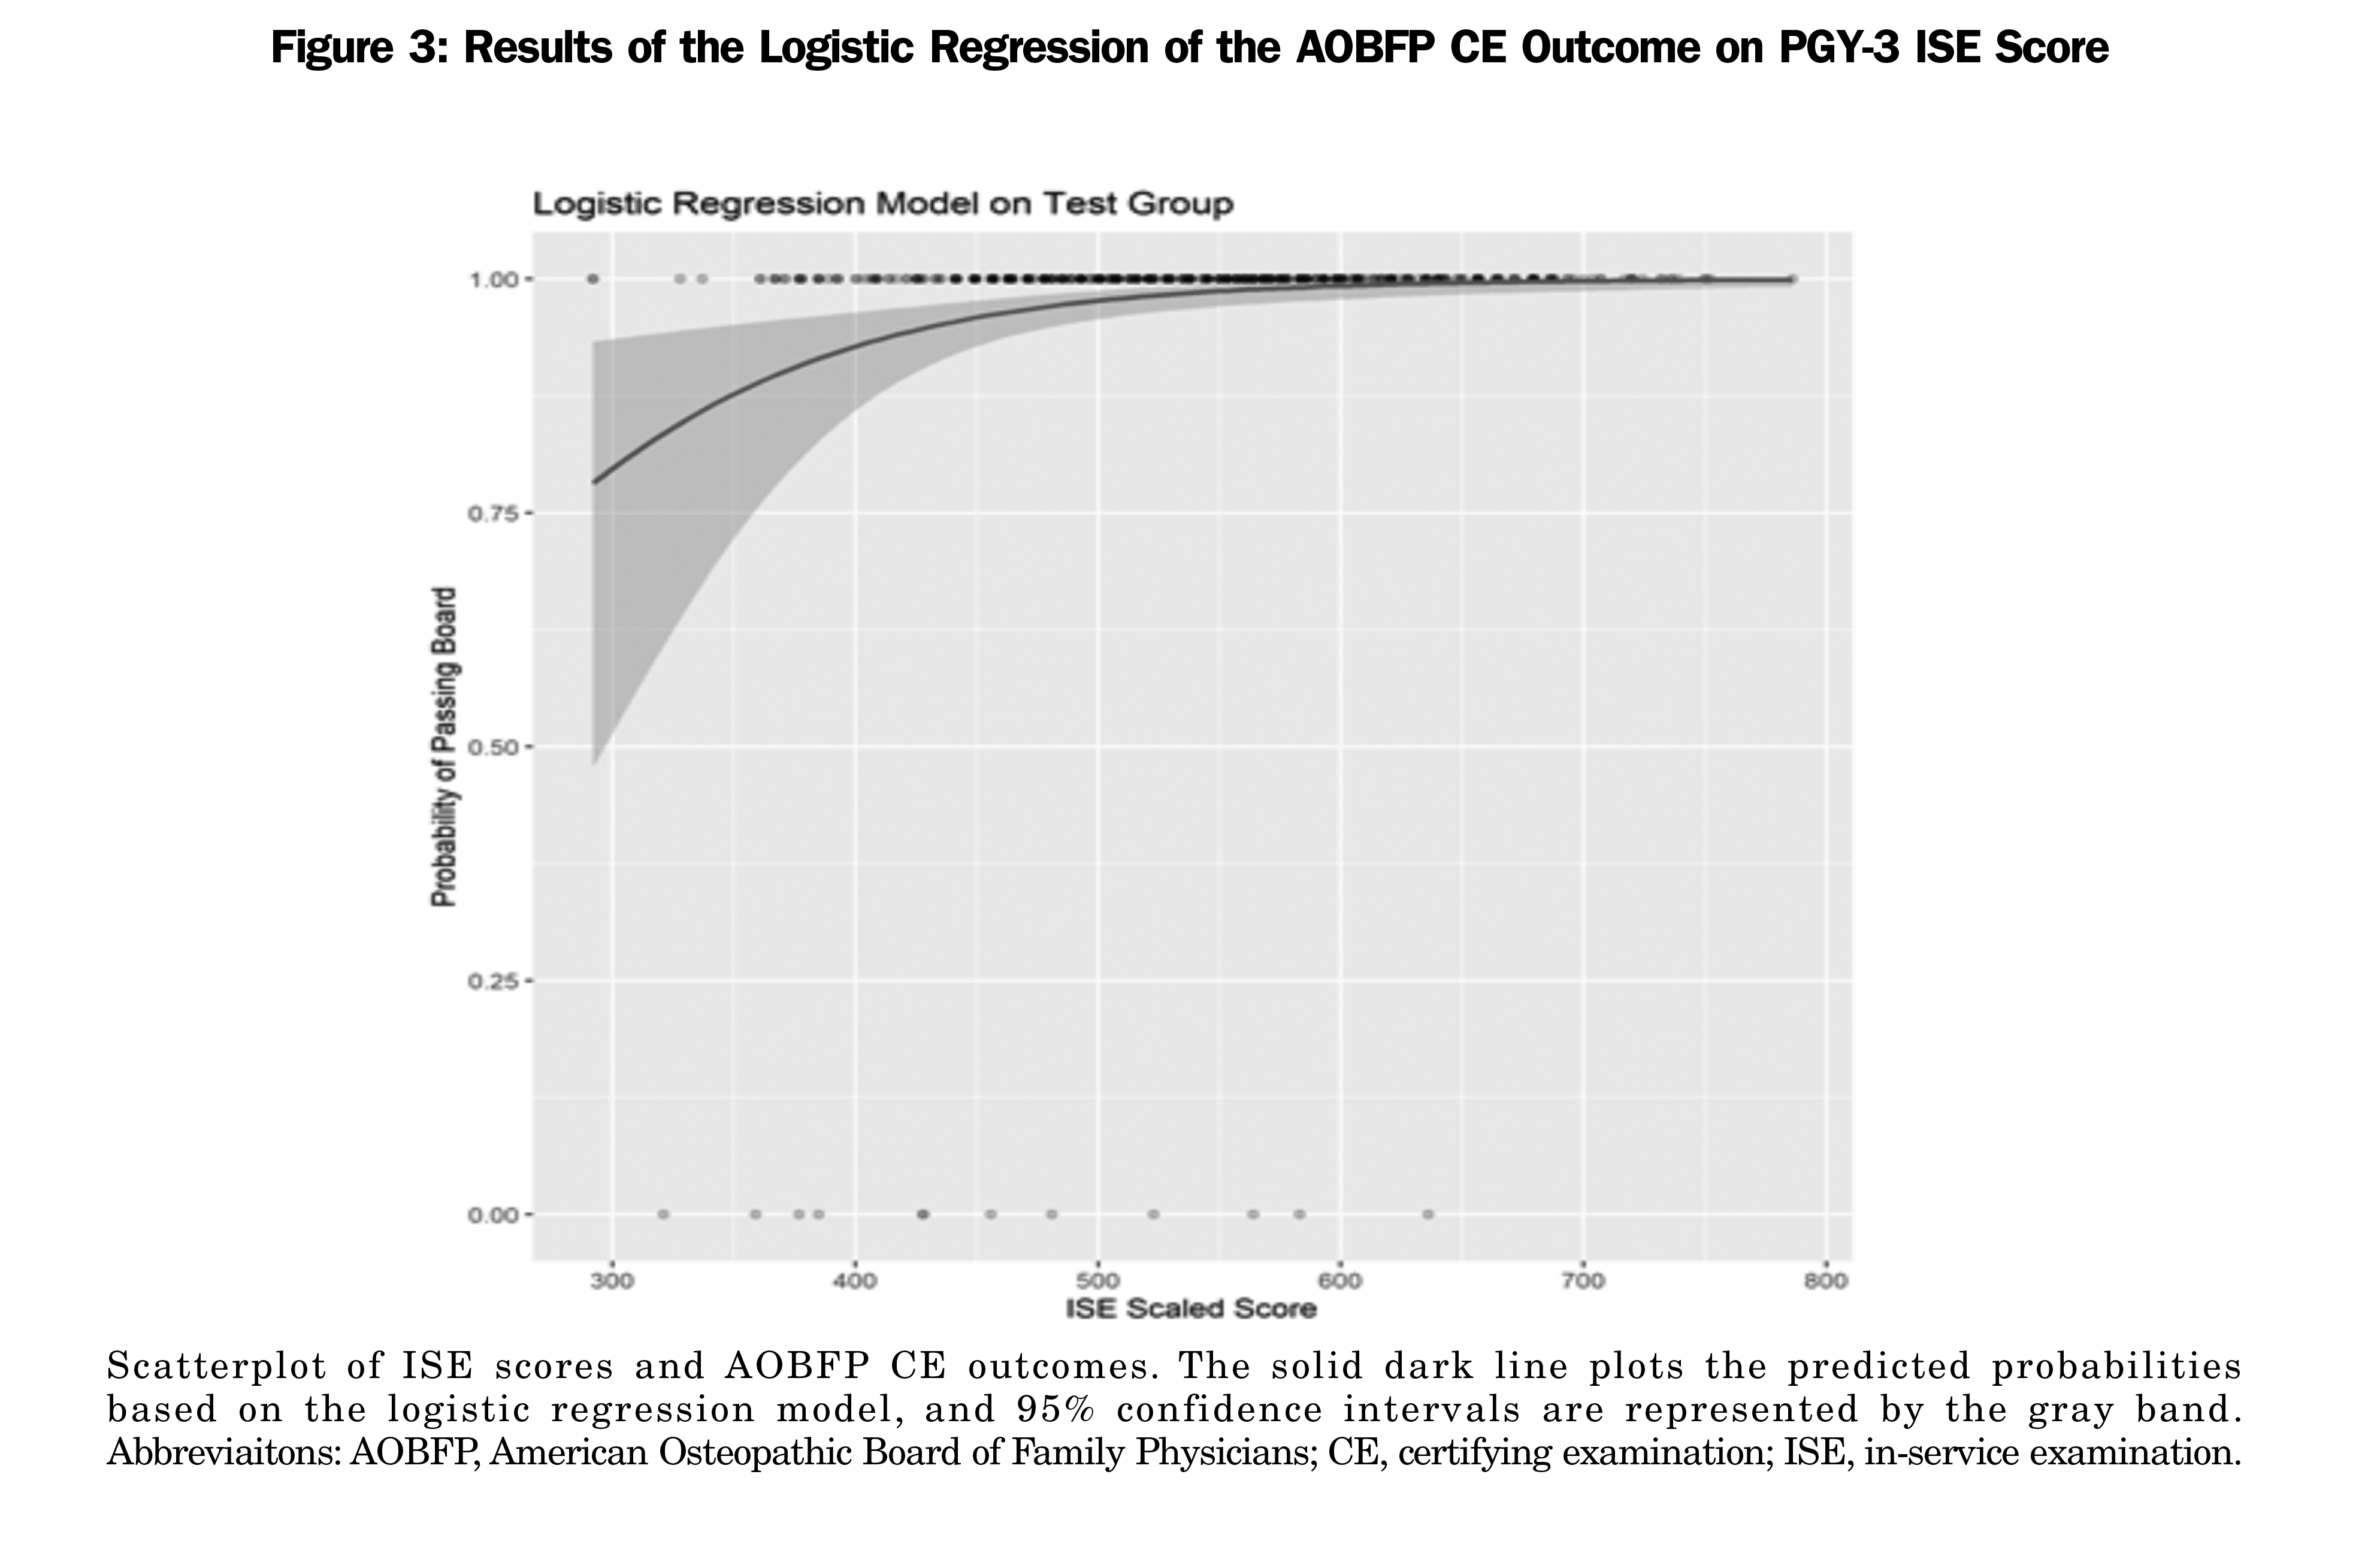
In our logistic regression model, the ISE scaled score was positively associated with CE outcomes (OR, 1.02; 95% CI 1.01–1.02; P<.001). Overall model evaluation included McFadden pseudo R2, .23; likelihood ratio test: χ2(1)=51.921, P<.01; and Wald test: χ2(1)=39.695, P<.01. We used the model on the test data set to predict probabilities of passing the AOBFP CE. The area under the curve (AUC) was .74, indicating the model had acceptable discrimination (ie, ability to identify AOBFP CE pass/fail classification based on ISE performance).13 Figure 3 provides a scatterplot of the observed PGY-3 ISE scores and AOBFP CE outcomes with the predicted probabilities from the logistic regression model. The scatterplot shows the observed scores and outcomes. The blue line plots the predicted probabilities based on the logistic regression model, and 95% confidence intervals are represented by the gray band.
Residency training programs serve to help residents consolidate and enhance their medical knowledge attained during medical school. Residency programs rely on high-quality formative assessments to help guide learning at the programmatic and individual resident levels as they work to prepare trainees for board certification examinations and independent clinical practice.
Sensitivity refers to a predictor’s ability to successfully classify true positives (ie, whether an in-service exam is capable of detecting people who are expected to pass the board exam, and whether they will receive a passing grade) and specificity refers to a predictor’s ability to successfully classify true negatives (ie, whether people who are not legitimately expected to pass a board exam will fail the in-service exam). Sensitivity and specificity are highly valuable indicators in many contexts; the disadvantage is that they both rely on 2 x 2 contingency tables, and the dividing line—formalized as a cut score—between qualified and not-qualified persons on summative and formative assessment depends on the input of committees of subject matter experts. Standards in educational testing represent a subject matter expert-determined level of proficiency that meets a criterion-referenced identified need. For medical certification, the focus is on providing safe and effective care to patients.
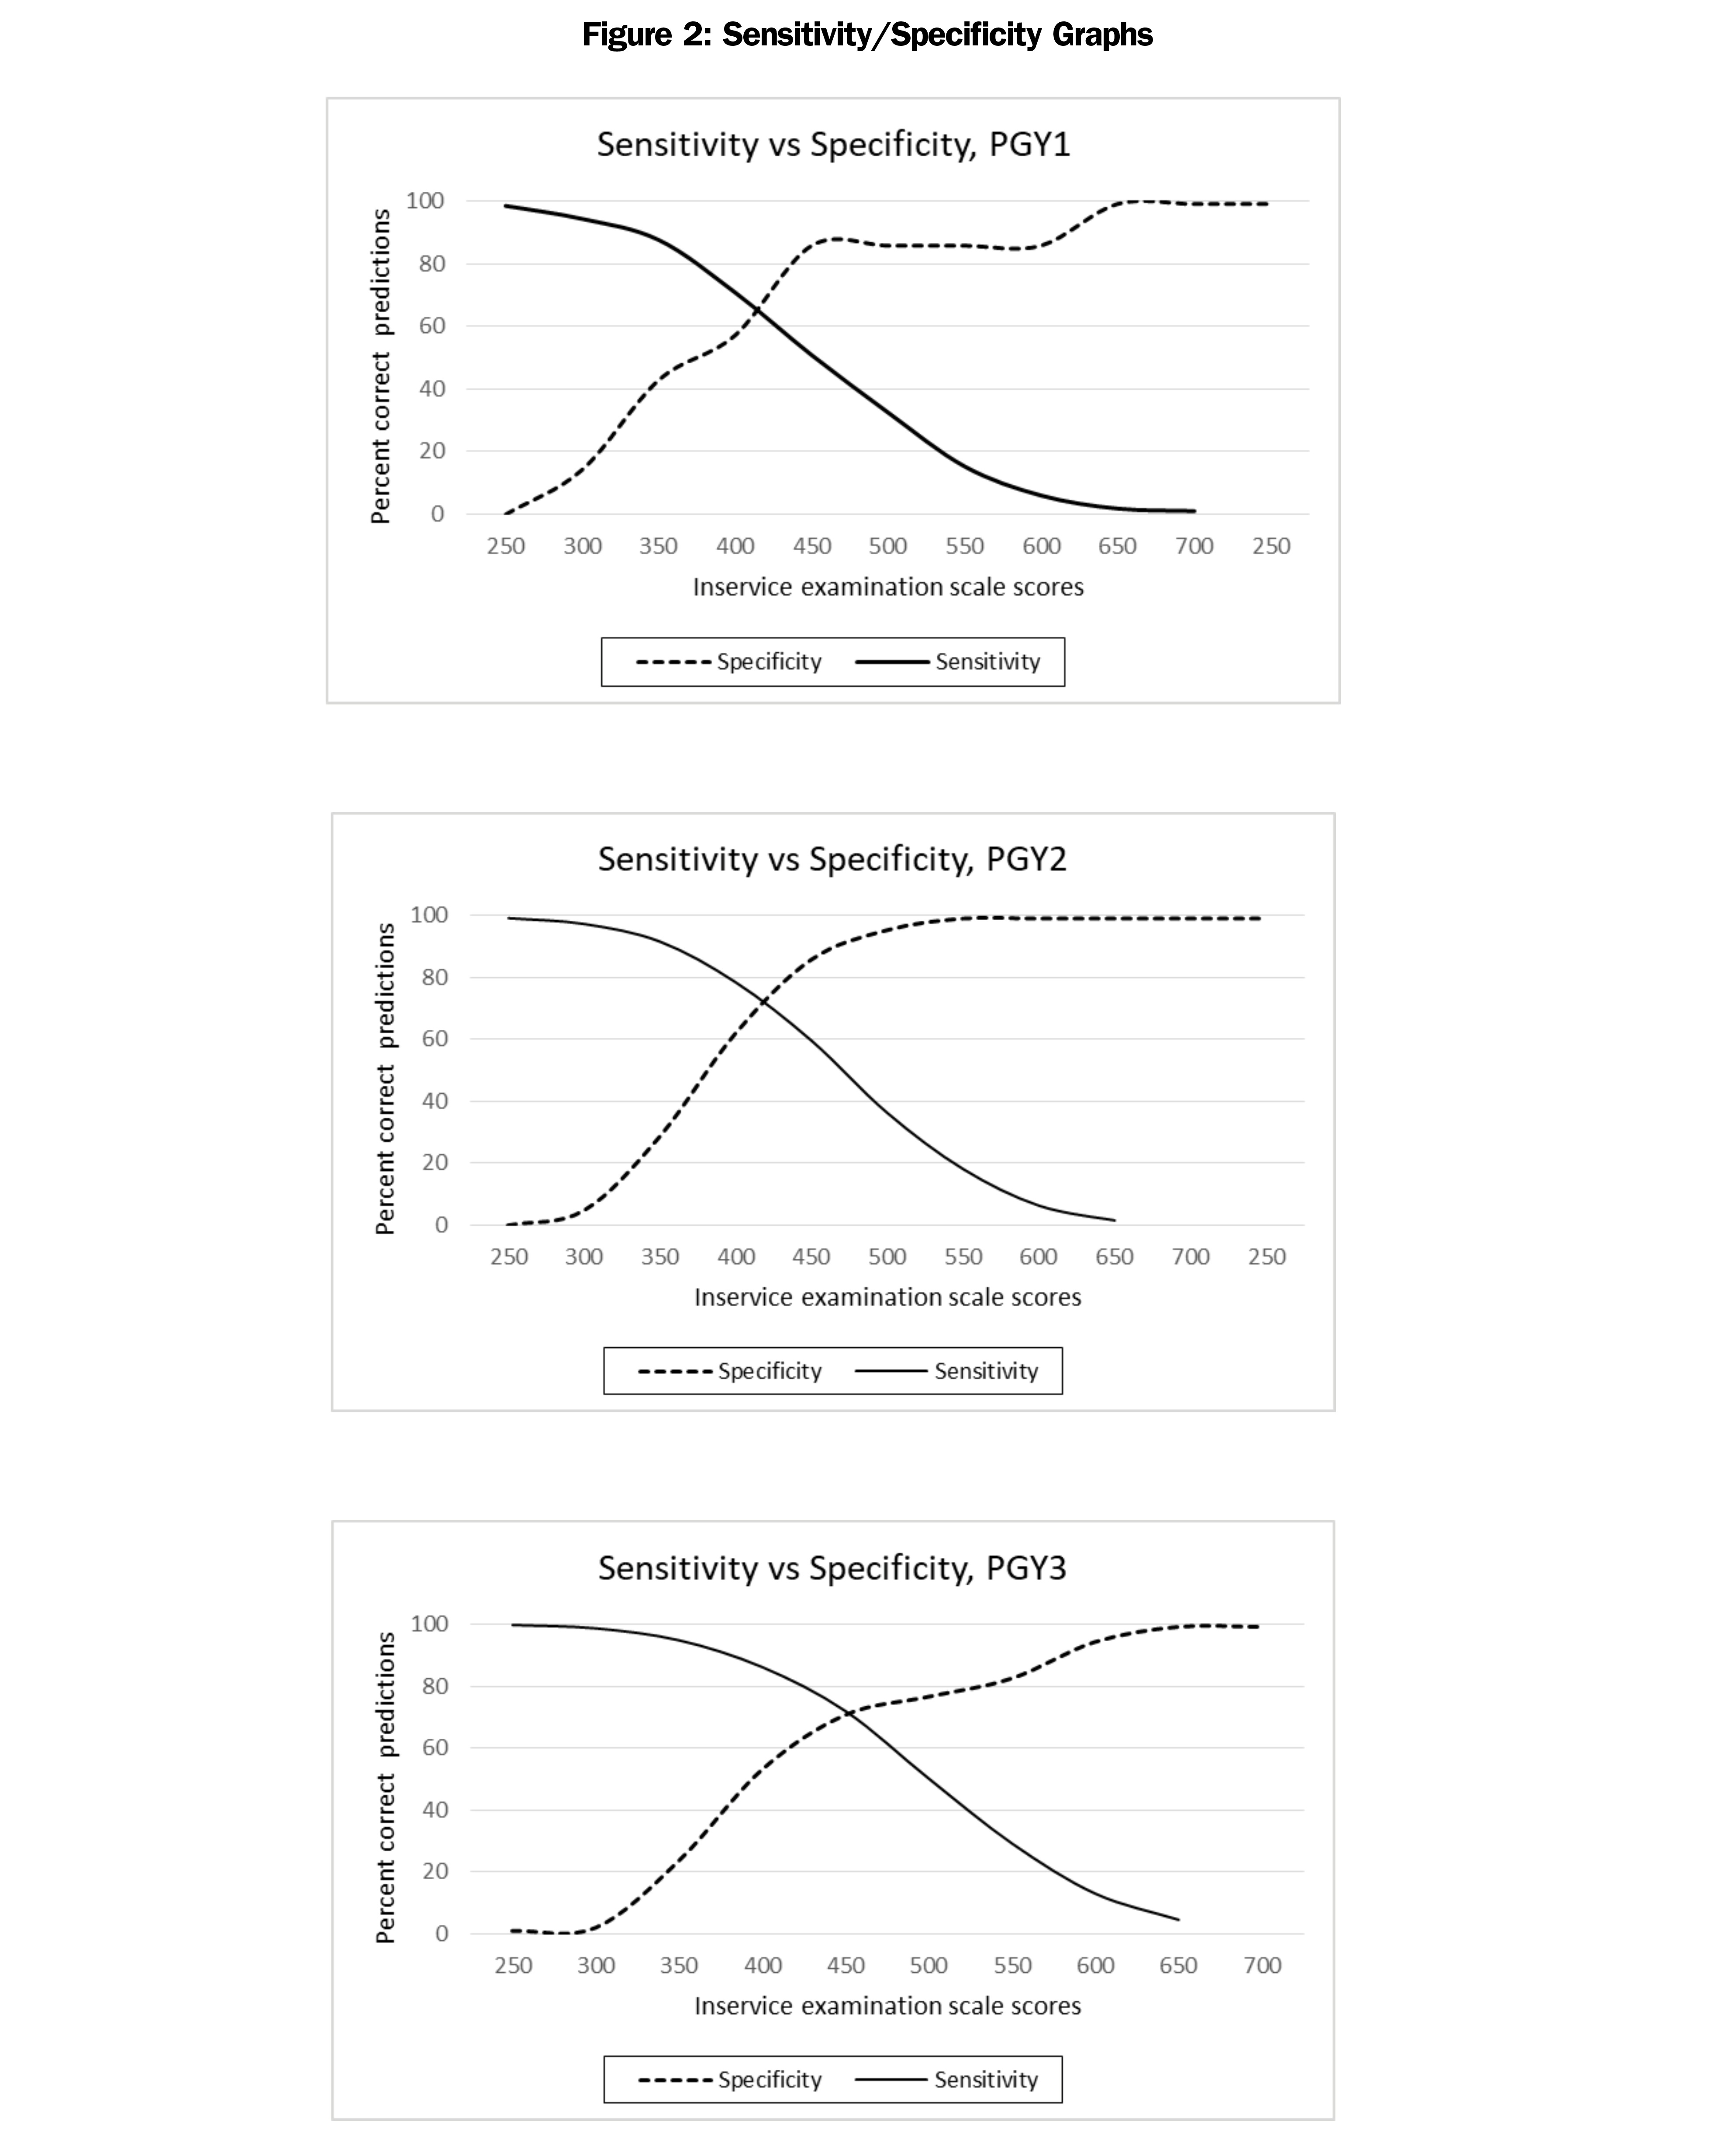
It is critical to realize that sensitivity and specificity in summative and formative assessment cannot be interpreted in the same way as in clinical trials. The dichotomization of a continuous variable loses a wealth of information that is regained when correlations are used instead. A comparison of the correlation results with the sensitivity and specificity results in this study are a strong illustration of the fact that a tool sufficient for one purpose is not necessarily sufficient for all purposes. Additional evidence of the inappropriateness of sensitivity and specificity for informing the study of very low base-rate behavior can be seen by examining the graphs in Figure 2; not only are they ungainly, but it is difficult to tell by viewing that the ability of in-service exams to detect a true fail on certification examinations is almost nonexistent, because there are few fails on the certification examinations, true or otherwise.
The graphs in Figure 2 do not highlight the difficulties inherent in a data set in which nearly everyone’s status on the outcome variable is the same. Interpretations of these graphs would be noisy at best and misleading at worst; they are not appropriate for use in this data set.
Sensitivity and specificity are often used as criteria for evaluating the precision of a predictor; however, the results of the current analyses are object lessons in not allowing sensitivity and specificity values to be the sole criteria on which to evaluate that worth.
There are limitations to how these results can be used in practices. Some sensitivity and specificity values are presented in this paper and in other literature call for cautious interpretations. The sensitivity, specificity, and predictive values in the 2 x 2 tables obscure the fact that the Φ coefficients for the dichotomized data are .15, .24, and .24 (for PGY1, PGY2, and PGY3, respectively). On both statistical and conceptual grounds, the correlational results on nondichotomized in-service examination data are more informative and more useful.
Sensitivity and specificity for a dichotomous event (passing or failing status of the AOBFP CE) can be suspect with a first-time test-taker failure rate of 2%, leaving very few individuals in one box of the 2 x 2 table. This is another limitation to these types of studies. The ROC curve based on the logistical regression demonstrated an acceptable level of statistical prediction in identifying AOBFP CE passing and failing classification based on ISE performance. Considering the probable level of remediation by candidates with lower ISE scores prior to attempting the AOBFP CE, the information provided to candidates and program directors likely represents a much higher value. Given the importance of board certification for safe, independent medical practice, certifying examinations must be reliable assessments of medical knowledge and decision making. Data presented herein support the value of the ISE in predicting performance on the subsequent AOBFP CE. Both the intrinsically flawed PPV/NPV analyses as well as the more accepted and rigorous Pearson correlations—between 0.48 and 0.68—attest to the predictive nature of diplomates possessing the requisite knowledge and skills to safely practice family medicine.
The logistic regression analysis highlights the usefulness of ISE scores for predicting AOBFP CE outcomes. As the 95% confidence intervals in Figure 3 illustrate, this prediction is much less reliable at lower score points. Most residents who performed poorly on the ISE exam went on to pass the AOBFP CE, suggesting that useful actionable data was provided to residents and their program directors to identify their deficiencies and help formulate effective remediation strategies. The arc of negative predictive value, with PGY1 (0.07), PGY2 (0.01), and PGY3 (0.12), may suggest that the information gathered during these ISE administrations earlier in residency training is most useful for developing successful remediation strategies for subsequent CE performance.
Osteopathically-recognized family medicine residency programs provide comprehensive, rich education to trainees, permitting graduates to certify through either the AOBFP or the ABFM. The inclusion of osteopathic principles in the AOBFP CE necessitates inclusion of osteopathic items in resident training exams to prepare for taking the AOBFP CE, such as those afforded by ISE.
Several recent changes to the board certification process in osteopathic family medicine via the AOBFP require future research and create further opportunities. The creation of an Early Entry Initial Certification (EEIC) pathway permits physicians to complete a condensed, more affordable initial CE if they have successfully completed the AOBFP ISE twice during residency training. Additionally, the AOBFP-ISE underwent structural changes in 2019 to strengthen its assessment of osteopathic content to better prepare diplomates for independent osteopathic family medicine practice. Repeating this analysis with these improved examinations will be necessary.
Reliable assessments of the quality of resident training examinations are crucial in preparing residents to pass subsequent certifying examinations. However, some measures purported to assess how well residents perform are lacking in quality. Particularly, sensitivity, specificity, negative predictive value and positive predictive value do not adequately capture the value of resident training examinations. While these measures suggest both test pathways are equally highly effective in predicting passage of certifying examinations, they should be interpreted with caution. More reliable measures discussed herein confirm that both examination pathways provide residents and program directors with meaningful information to assess knowledge deficits and prepare them to successfully pass the relevant certifying examinations.
References
- Latest Figures Spotlight Continued Growth in Osteopathic Medical School Enrollment. American Association of Colleges of Osteopathic Medicine. Published January 9, 2019. Accessed March 30. 2022. https://www.aacom.org/news-and-events/news-detail/2019/01/09/latest-figures-spotlight-continued-growth-in-osteopathic-medical-school-enrollment
- More than 6,500 DOs join workforce in 2018. American Osteopathic Association. Accessed March 30, 2022. https://osteopathic.org/about/aoa-statistics/
- Osteopathic Medical Schools Graduated a Record Number of New Physicians in 2018. Physicians News Digest. Accessed March 30, 2022. https://physiciansnews.com/2019/01/15/osteopathic-medical-schools-graduated-a-record-number-of-new-physicians-in-2018/
- Hudson KM, Feinberg G, Hempstead L, Zipp C, Gimpel JR, Wang Y. Association between performance on COMLEX-USA and the American College of Osteopathic Family Physicians in-service examination. J Grad Med Educ. 2018;10(5):543-547. doi:10.4300/JGME-D-17-00997.1
- Li F, Gimpel JR, Arenson E, Song H, Bates BP, Ludwin F. Relationship between COMLEX-USA scores and performance on the American Osteopathic Board of Emergency Medicine Part I certifying examination. J Am Osteopath Assoc. 2014;114(4):260-266. doi:10.7556/jaoa.2014.051
- Pierce DL, Mirre-Gonzalez MA, Carter MA, Nug D, Salamanca Y. Performance on COMLEX-USA exams predicts performance on EM residency in-training exams. Acad Emerg Med. 2013;20(5)(suppl 1):S219.
- Sevensma SC, Navarre G, Richards RK. COMLEX-USA and in-service examination scores: tools for evaluating medical knowledge among residents. J Am Osteopath Assoc. 2008;108(12):713-716.
- Cavalieri TA, Shen L, Slick GL. Predictive validity of osteopathic medical licensing examinations for osteopathic medical knowledge measured by graduate written examinations. J Am Osteopath Assoc. 2003;103(7):337-342.
- Roberts WL, Gross, GA, Gimpel JR, et al. An investigation of the relationship between COMLEX-USA licensure examination performance and state licensing board disciplinary actions. Acad Med. 2020;95(6):925-930. doi:10.1097/ACM.0000000000003046
- O’Neill TR, Li Z, Peabody MR, Lybarger M, Royal K, Puffer JC. The Predictive validity of the ABFM’s In-Training Examination. Fam Med. 2015;47(5):349-356.
- O’Neill TR, Li Z, Peabody MR, Lybarger, M, Royal K, Puffer JC. The Predictive validity of the National Board of Osteopathic Medical Examiners’ COMLEX-USA examinations with regard to outcomes on American Board of Family Medicine Examinations. Acad Med. 2016;91(11):1568-1575. doi:10.1097/ACM.0000000000001254
- McFadden D. Quantitative methods for analyzing travel behaviour of individuals: some recent developments. 1977. Cowles Foundation Discussion Paper No. 474, Cowles Foundation for Research in Economics at Yale University.
- Tape TG. The area under an ROC curve. Interpreting diagnostic tests. Accessed March 30, 2022. http://gim.unmc.edu/dxtests/ROC3.htm.


There are no comments for this article.